Monitoring Dashboard
The Monitoring Dashboard is the landing page of the Monitoring module. It gives you an at-a-glance view of your organization's real-time call activity, agent state, queue health, and browser monitor telemetry on a single page. Use it as your first stop when you want to confirm that things are running normally before drilling into a specific monitoring tool.
The dashboard is composed of the following sections, each rendered as its own card:
- System Overview — four live metric cards with 12-hour sparklines.
- WebEx Contact Center — agent state and idle code breakdowns, plus per-queue statistics.
- Browser Monitor Analytics — browser, version, and ISP distribution for the last 24 hours.
- Agent Locations — a US map of agent browser sessions for the last 24 hours.
Sections that have no data for your organization are hidden automatically.
Accessing the Dashboard
-
Navigate to the Monitoring module from the top navigation bar.
-
Open the Dashboard page. It is the default landing page for the module.
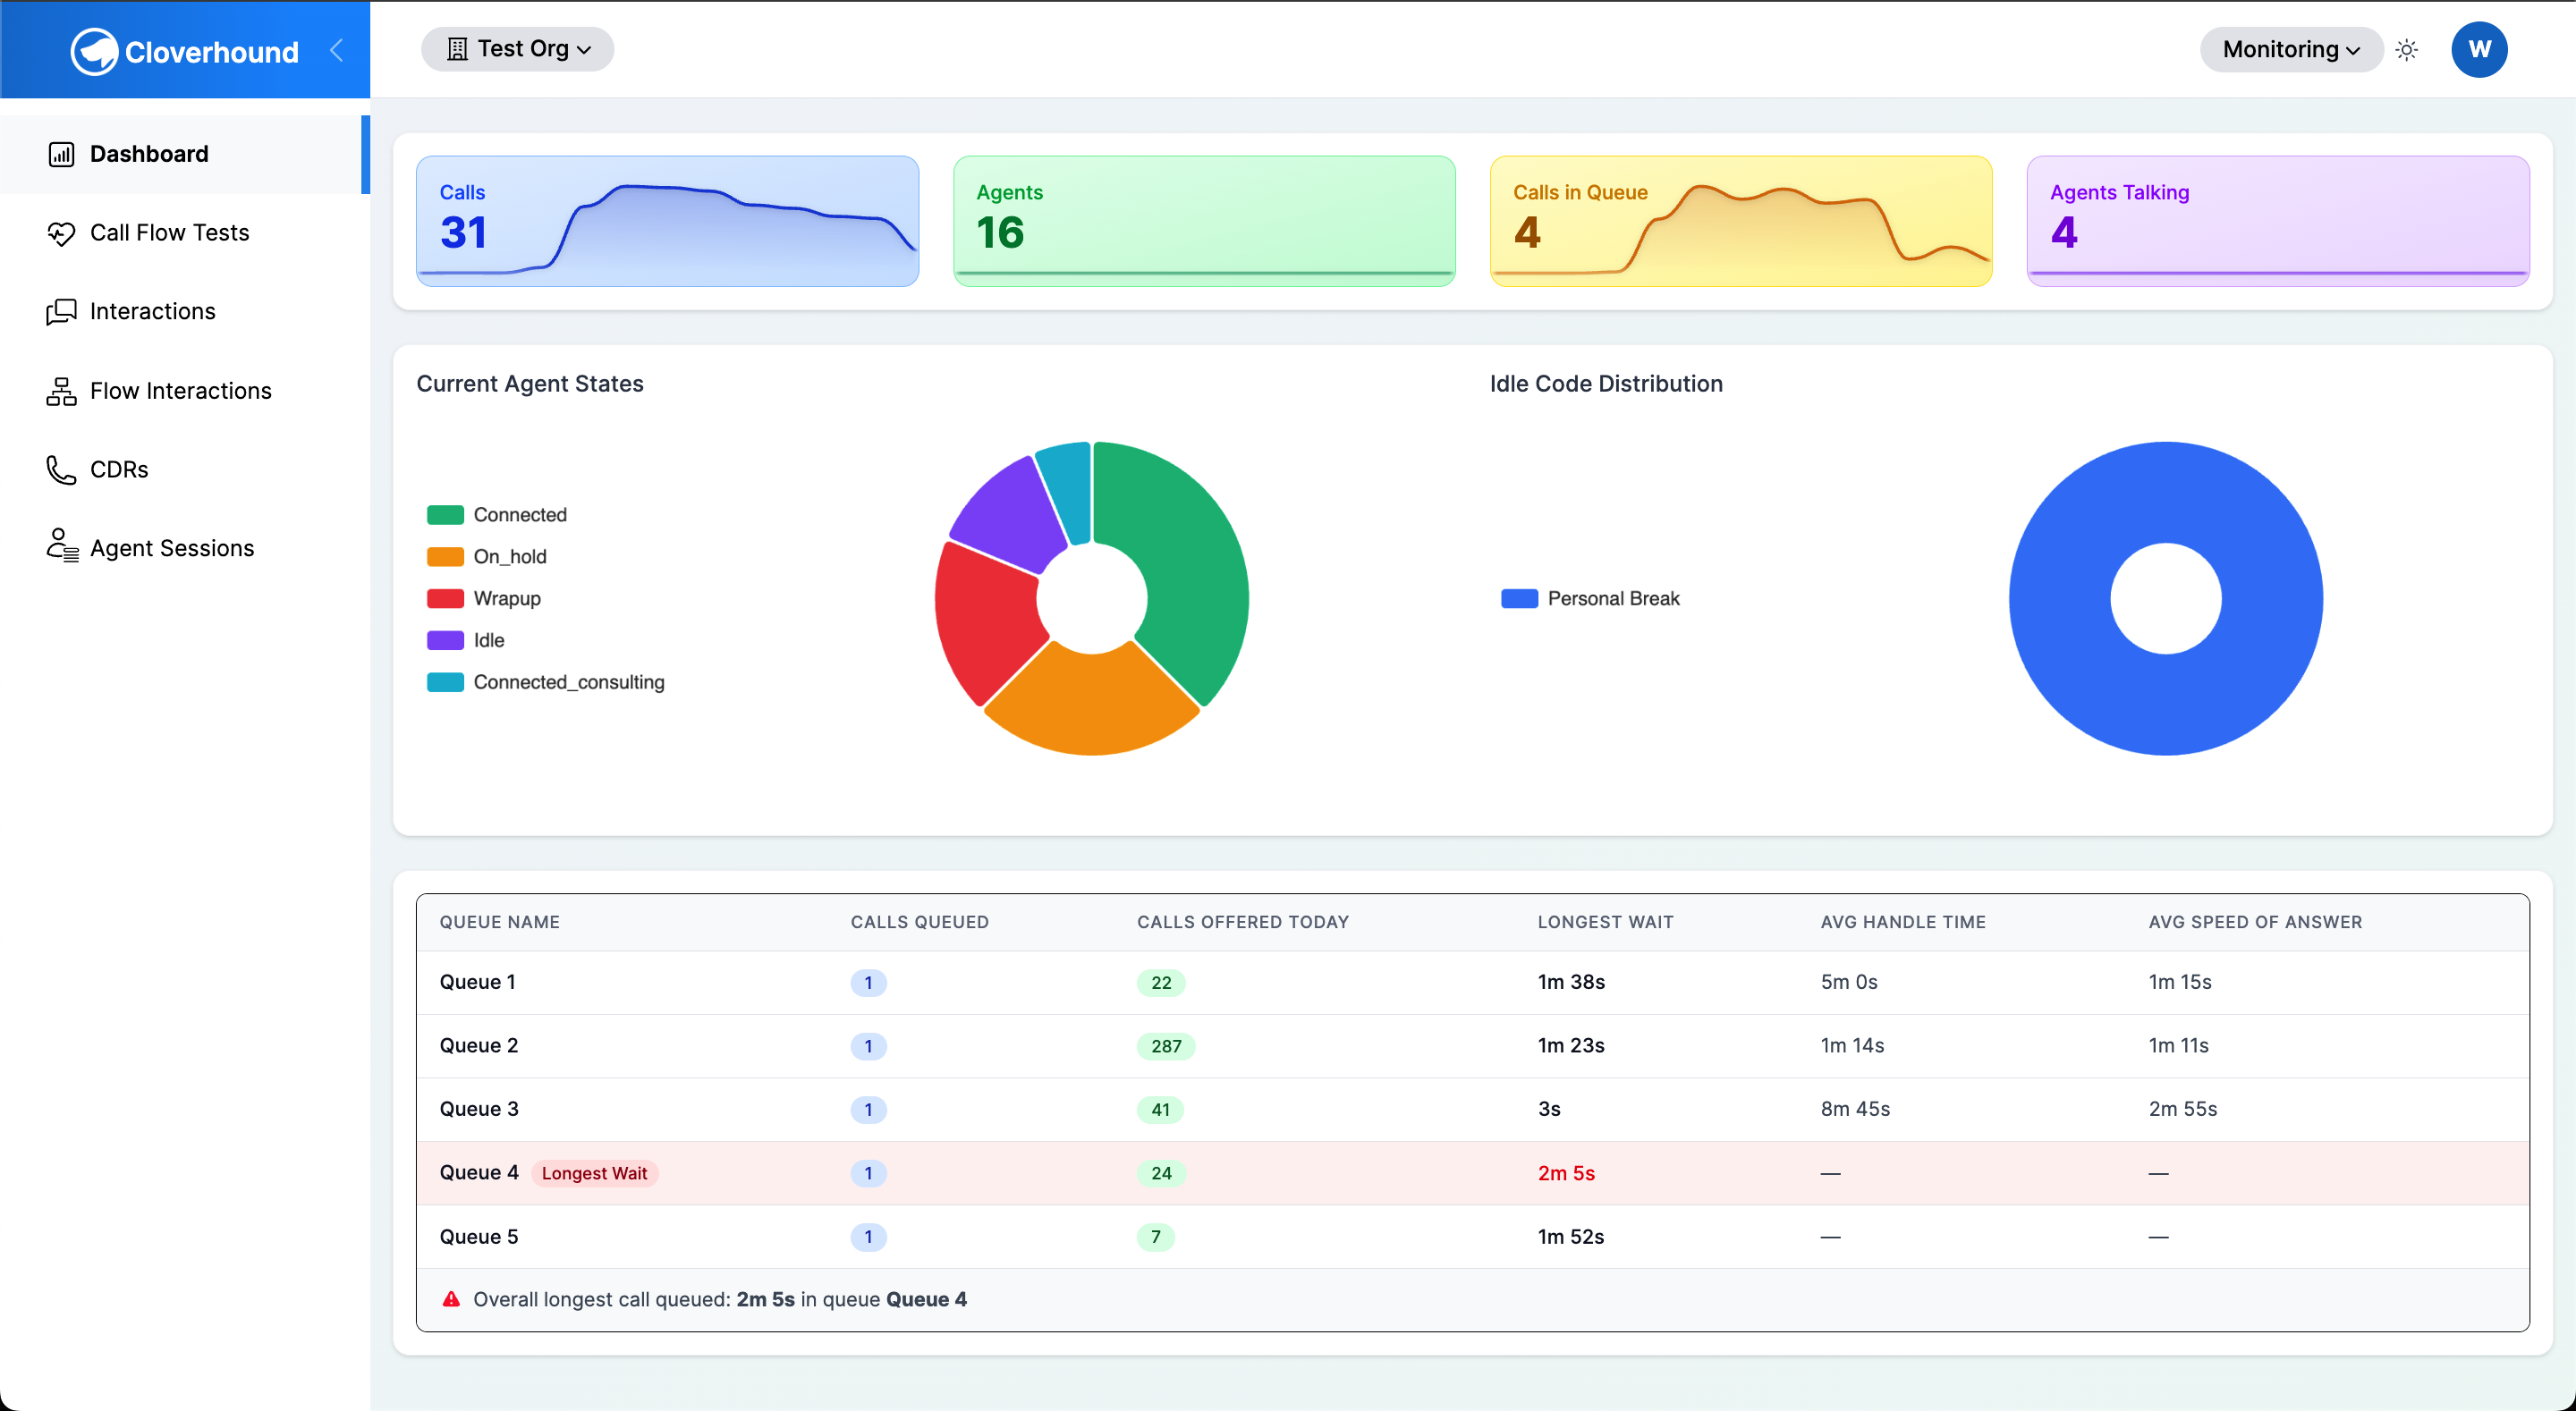
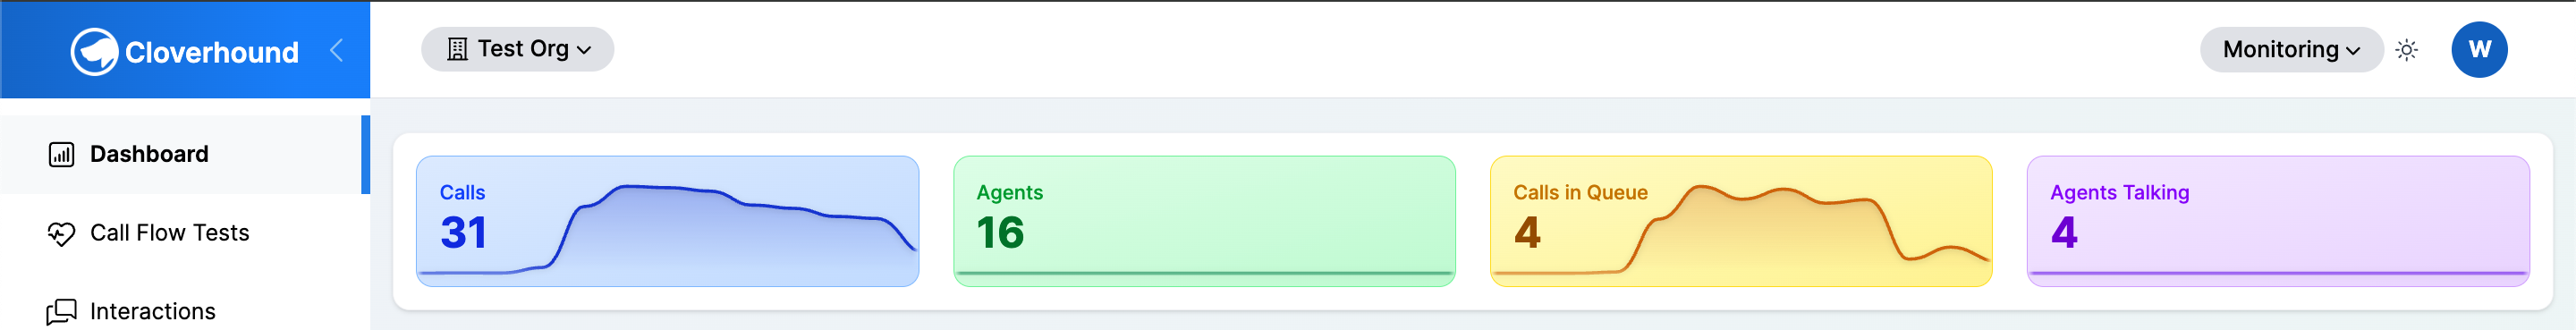
System Overview
The top card shows four real-time metrics for your organization. Each card displays the current value, formatted with a thousands separator, and a sparkline of the last 12 hourly buckets.
- Calls — the total number of active voice calls reported by the WebEx API.
- Agents — the total number of agents currently logged in.
- Calls in Queue — the number of voice calls currently queued (parked) across all queues.
- Agents Talking — the number of agents in the
connectedstate.
The current values come from the WebEx API. The sparklines are computed from interaction, agent session, and agent session event history stored in Cloverhound Cloud and are bucketed by the hour. Empty hours appear as zeros so the sparklines always span the full 12-hour window.
If the WebEx API is unreachable, the four current values fall back to zero and the error is logged. The 12-hour sparklines continue to render from historical data.
WebEx Contact Center
This section appears only when your organization has a WebEx Contact Center integration configured and at least one of agent states, idle codes, or queue statistics is present.
-
Review the Current Agent States pie chart. Each slice represents a WebEx agent state (for example, Available, Idle, Connected). States with a zero count are filtered out. If there are more than eight non-zero states, the top seven are shown and the rest are grouped as Other.
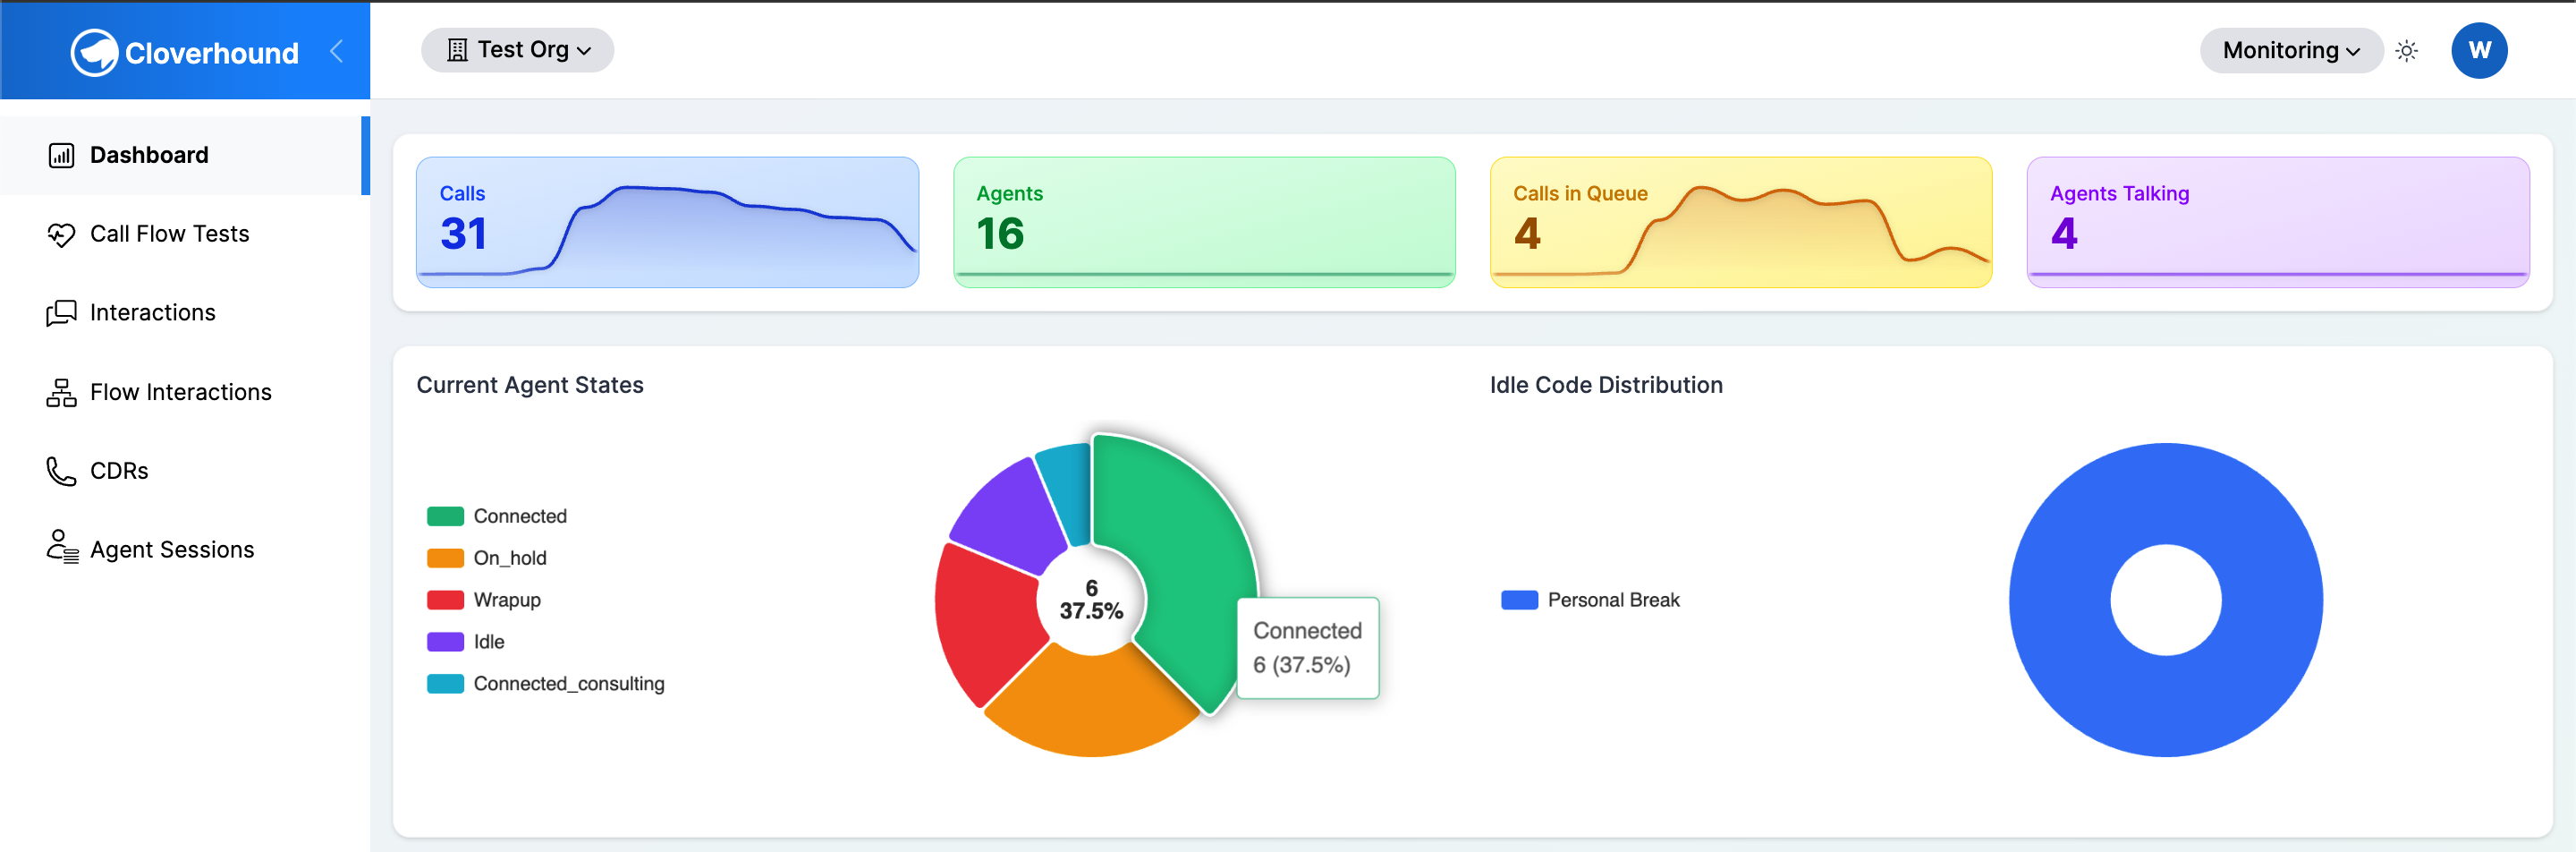
-
Review the Idle Code Distribution pie chart. It shows how agents in an idle state are split across the idle codes configured in WebEx. Idle codes with no assigned label are shown as Unknown.
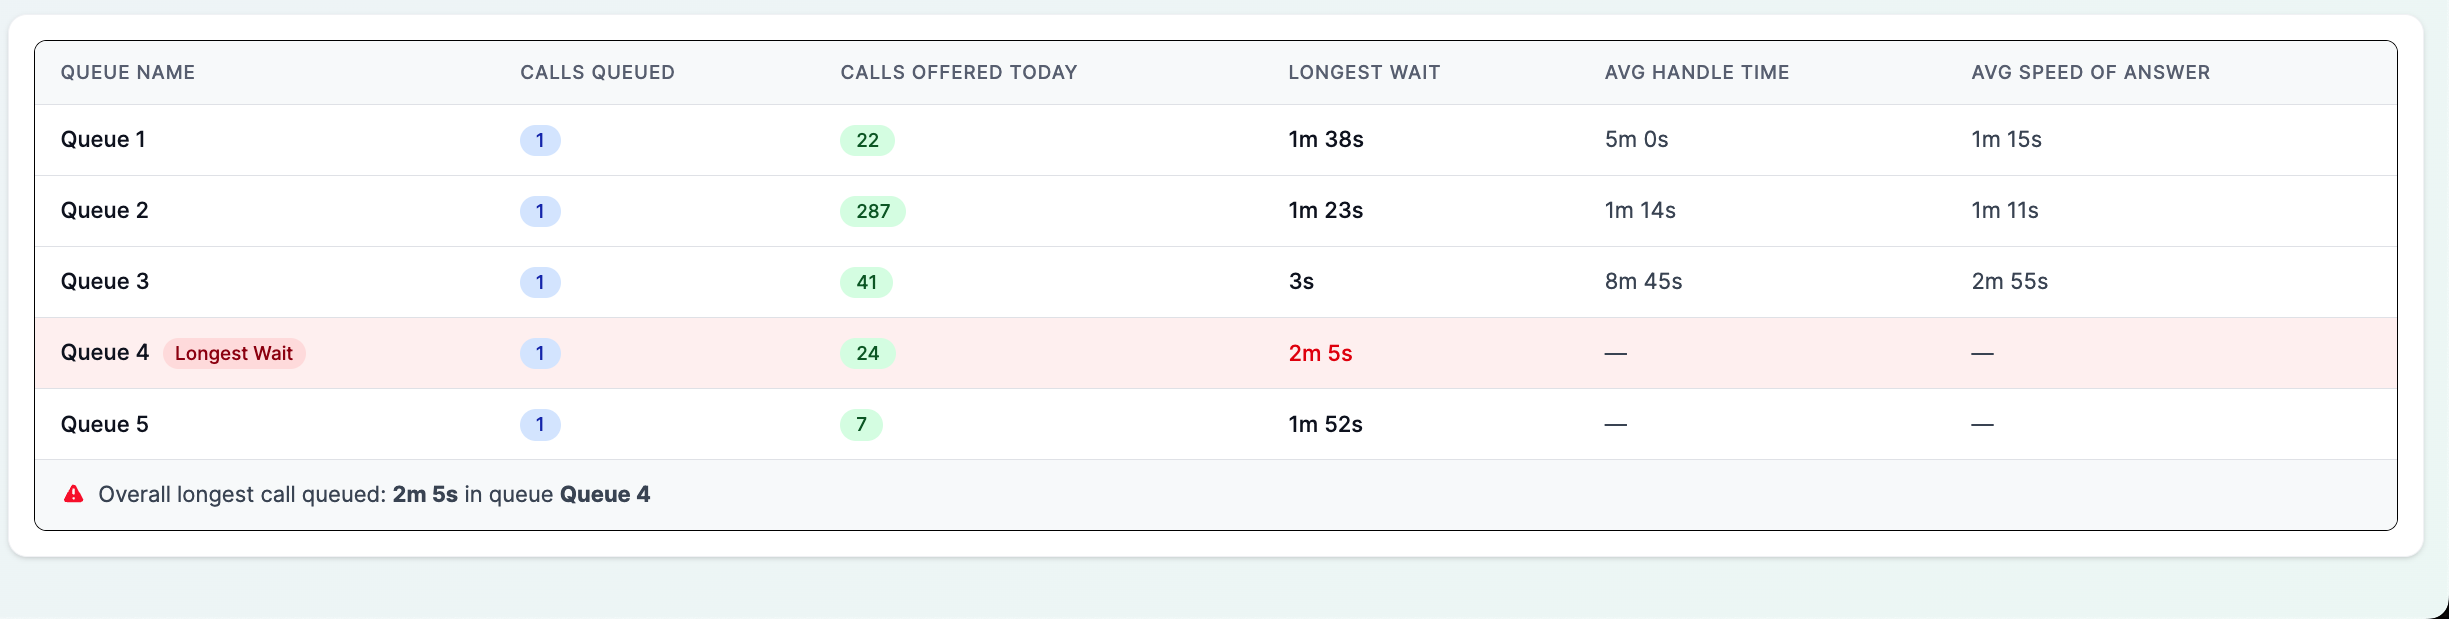
-
Review the Queue Statistics table below the pie charts. For each queue, the table surfaces live counts and the longest call currently queued. The banner above the table highlights the single longest call across all queues and names the queue it is in.
WebEx statistics are cached for one minute to limit API load.
Browser Monitor Analytics
This section appears when browser monitor sessions exist for your organization in the last 24 hours. It helps you spot agents running outdated browsers or connecting through unexpected networks.
-
Review the Browser & Version Distribution pie chart. Each slice is a distinct
browser + versioncombination. Only the top eight are shown; the remainder is grouped as Other.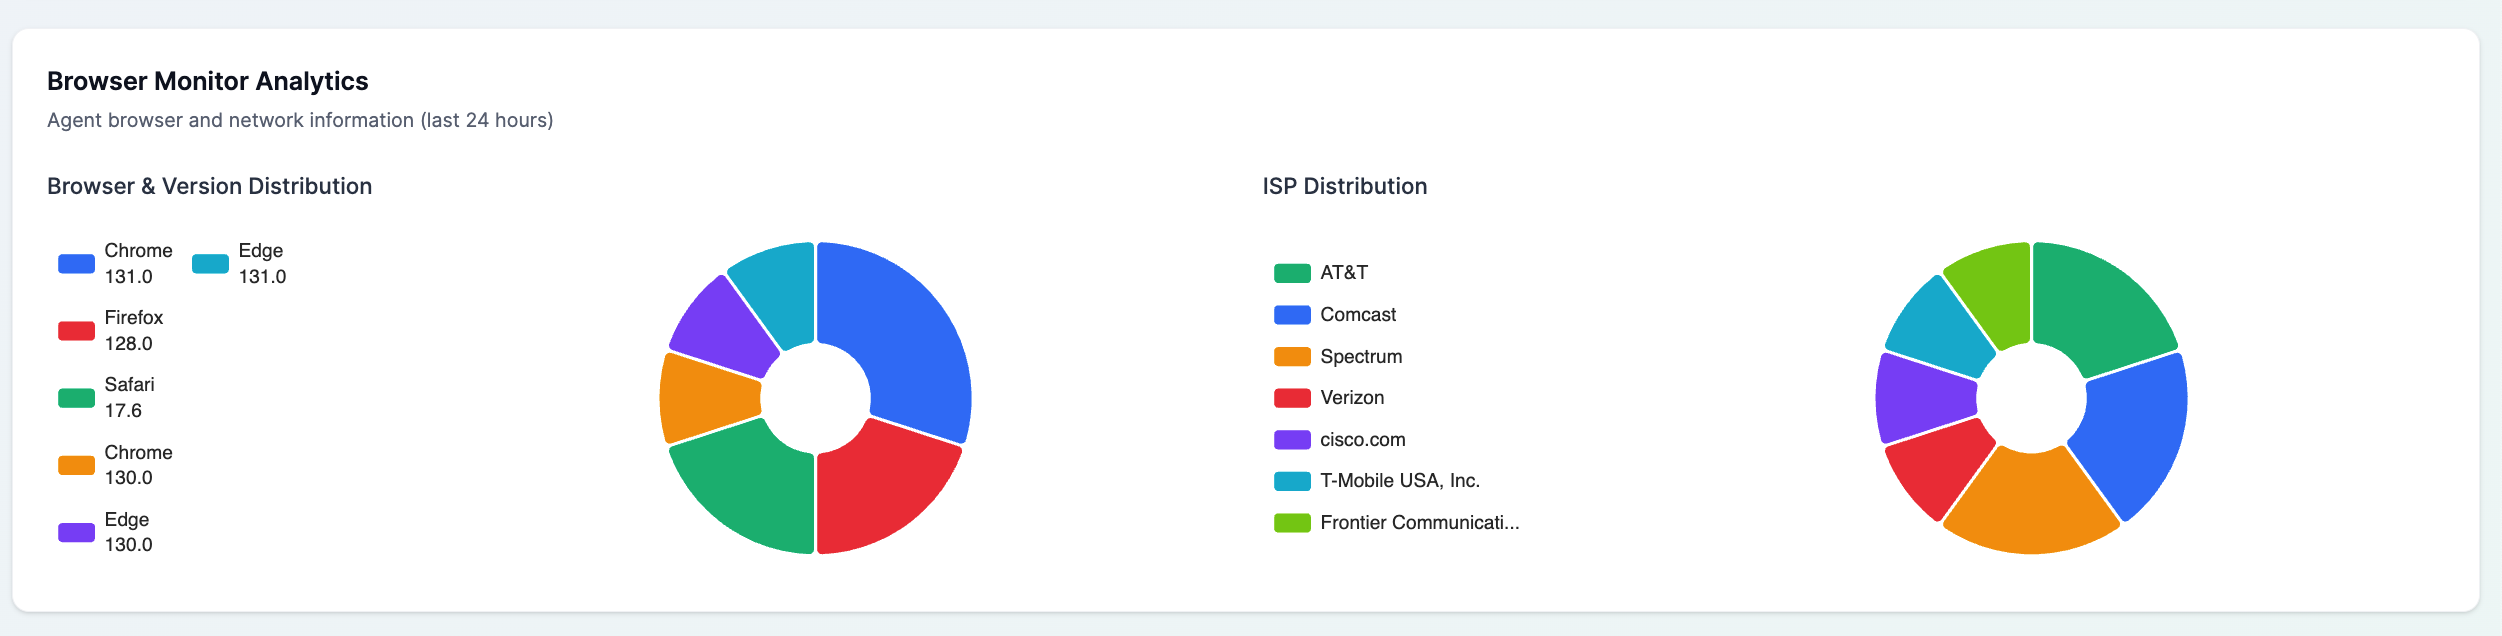
-
Review the ISP Distribution pie chart. ISP names are normalized, so variants such as Xfinity and Comcast Cable collapse into
Comcast.
Browser analytics are cached for ten minutes.
Agent Locations
This section appears when the last 24 hours of browser monitor sessions include geolocated US entries.
-
Review the US map. Each marker represents a city-level location where agents have connected, sized by session count.
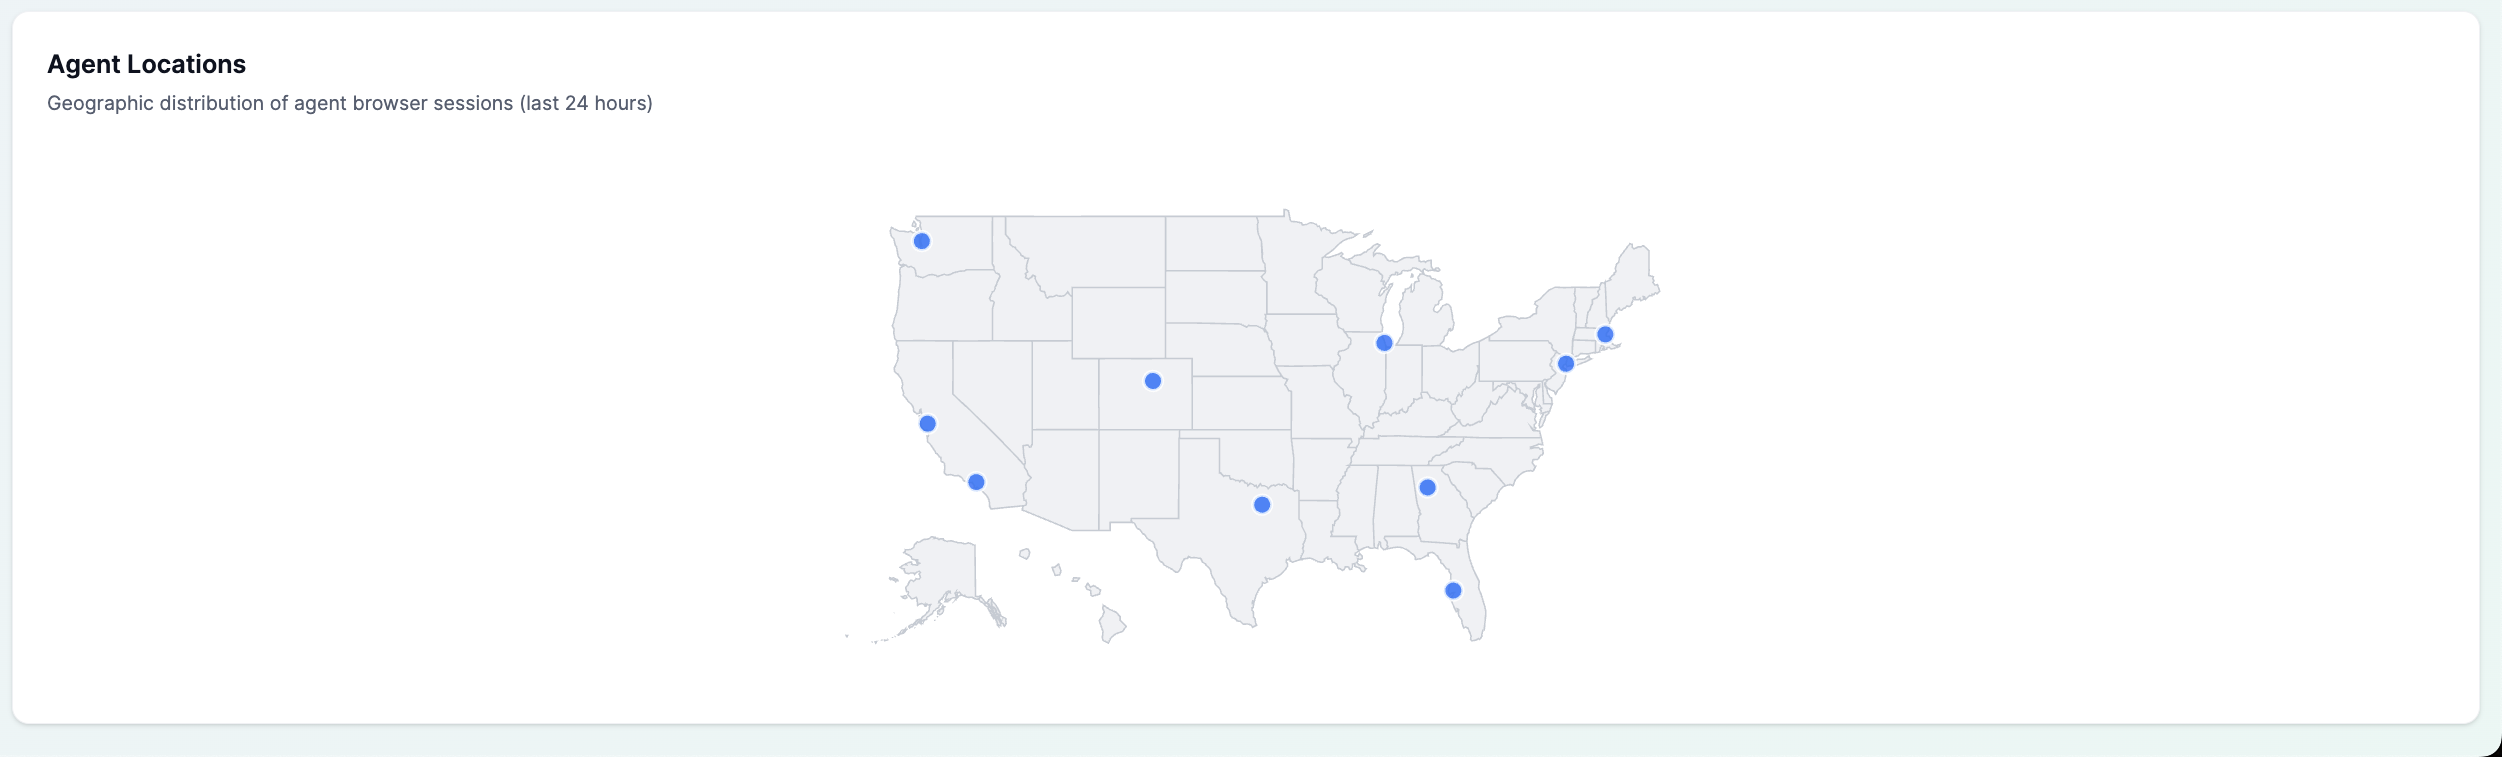
Only sessions with a country of United States and valid latitude and longitude are plotted. Locations are grouped by city and state and rounded to two decimal places of latitude and longitude, so nearby sessions collapse into a single marker. Sessions outside the US or without coordinates are excluded from the map but still contribute to the browser and ISP charts above.
Data Freshness and Troubleshooting
Most sections of the dashboard are cached to keep the page responsive:
- System Overview current values are fetched live from the WebEx API on each page load.
- Sparklines are recomputed from the database every 5 minutes per organization.
- WebEx Contact Center statistics are cached for 1 minute.
- Browser Monitor Analytics and Agent Locations are cached for 10 minutes.
If a section you expect to see is missing, confirm that your organization has the relevant integration. The WebEx card requires a configured WebEx Contact Center connection. The Browser Monitor Analytics and Agent Locations cards require recent browser monitor session data; if no sessions have been recorded in the last 24 hours both cards are hidden.
You now know what each section of the Monitoring Dashboard shows, where its data comes from, how often it refreshes, and when a card will be hidden for your organization.