Viewing Test Runs
Each time Cloverhound Cloud executes a Call Flow Test, whether on a schedule or on demand, it records an Application Test Run. The Runs history shows you when each run started, how long it took, whether it passed, which schedule (if any) triggered it, and the individual step results captured during the call.
Use this page to confirm that a test is healthy, to investigate a failure, and to drill into the transcript of a specific run.
For the test definition and its schedules, see Managing Call Flow Tests and Managing Test Schedules.
Accessing the Runs tab
-
Navigate to the Monitoring module.
-
Open the Call Flow Tests page.
-
Click the test whose history you want to review.
-
Select the Runs tab.
By default, the tab shows runs from the last seven days in your organization's time zone, sorted by Started descending (most recent first).
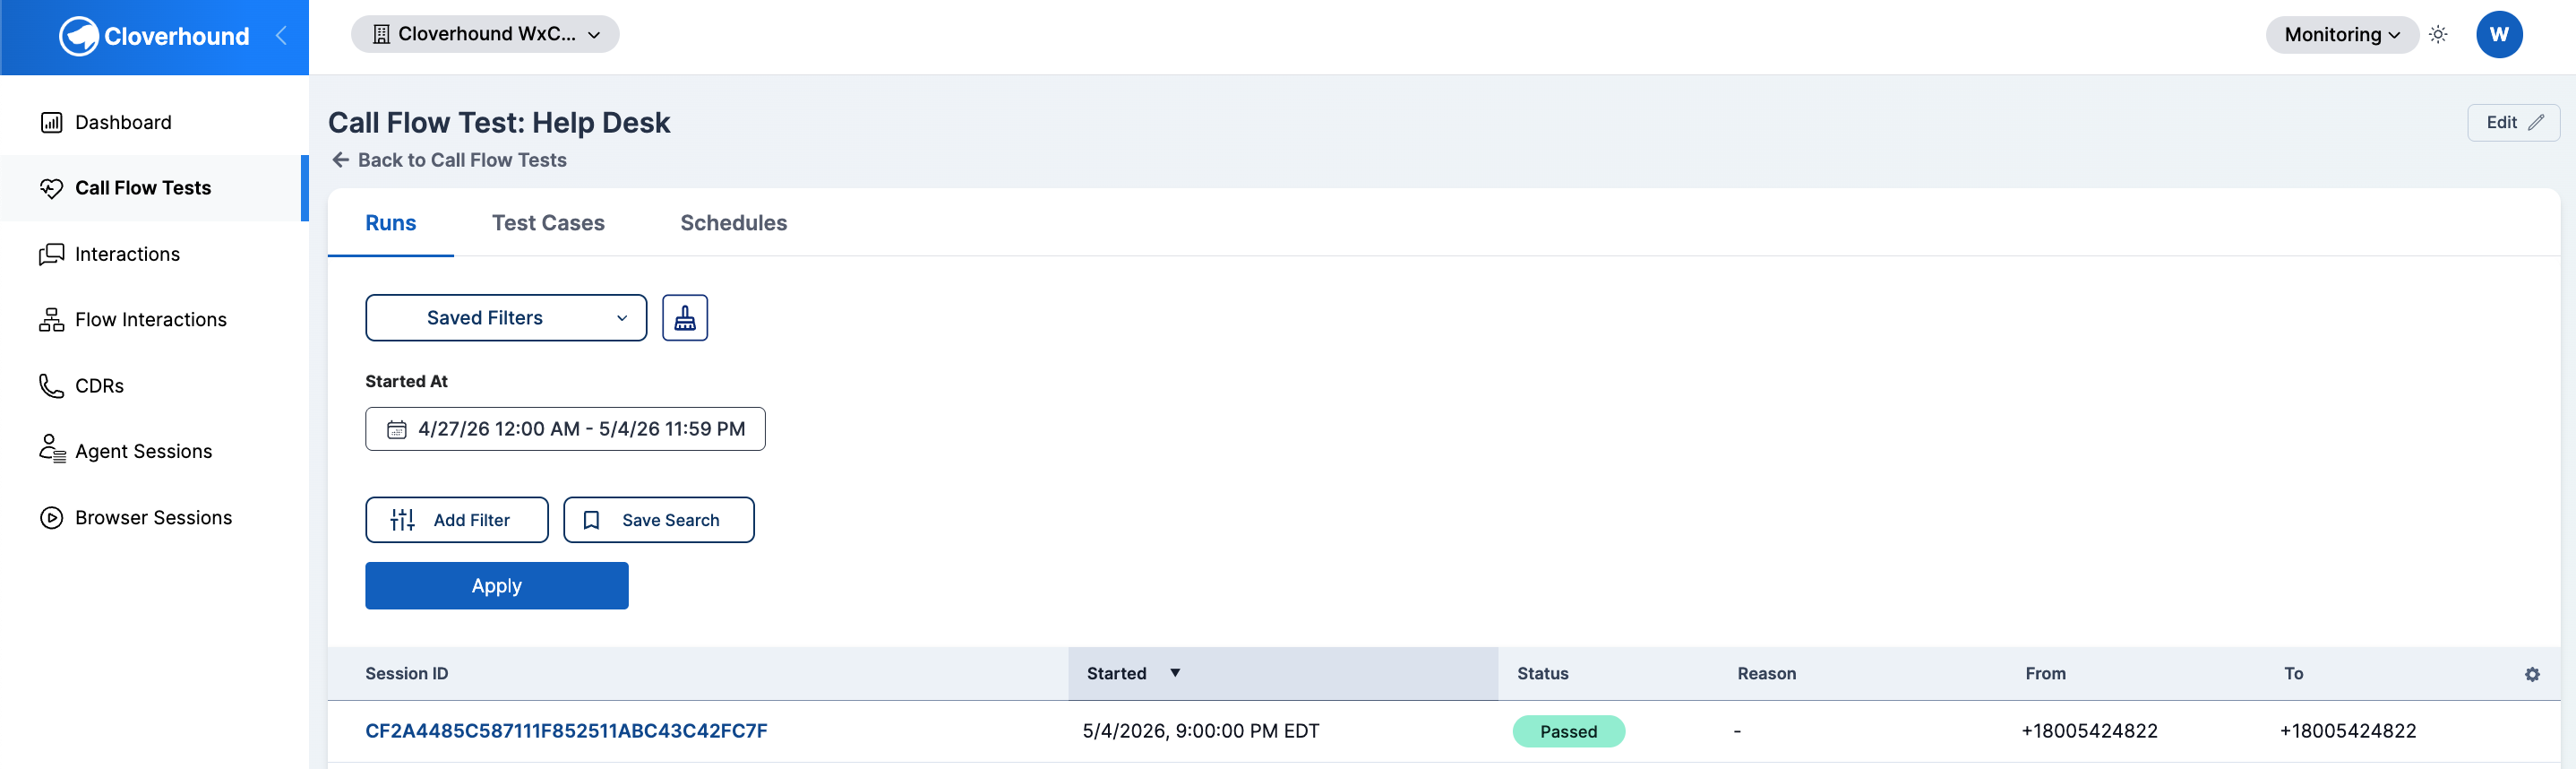
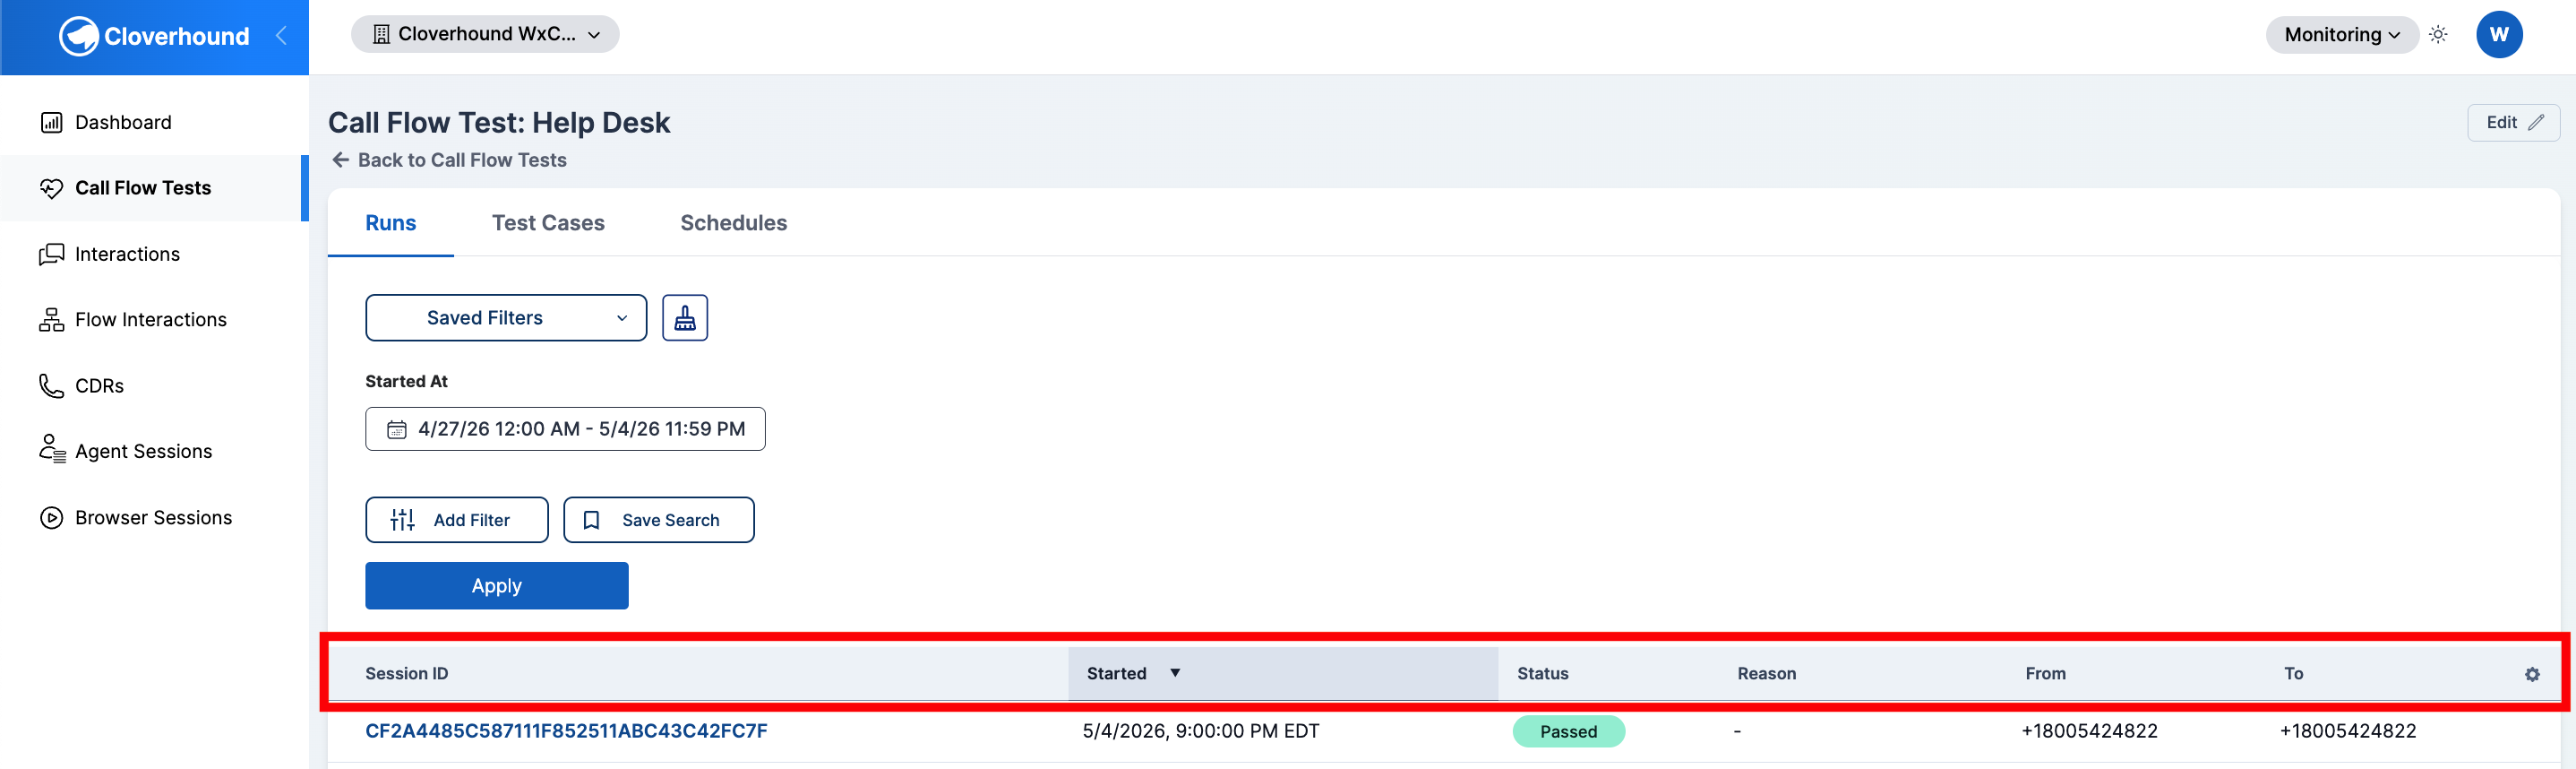
Reading the Runs Table
Each row in the Runs table represents one execution of the Call Flow Test. The columns show:
-
Session ID — the unique identifier for the run. Click it to open the run's detail page.
-
Started — the date and time the run began, shown in your organization's time zone.
-
Status — a colored pill summarizing the outcome: Passed, Failed, Running, Retry, Pending, Dialing, or Cancelled.
-
Reason — a short code explaining why a non-passing run ended that way (for example,
wrong_message,call_no_answer,early_hangup). Empty for runs that passed. -
From — the source phone number the test call was placed from.
-
To — the destination phone number the test called.
A dash (-) means the field was not recorded for that run.
Cancelled runs are hidden from standard operator views and are visible only to master administrators. Runs that are temporarily retrying show with a Retry pill until the next attempt resolves.
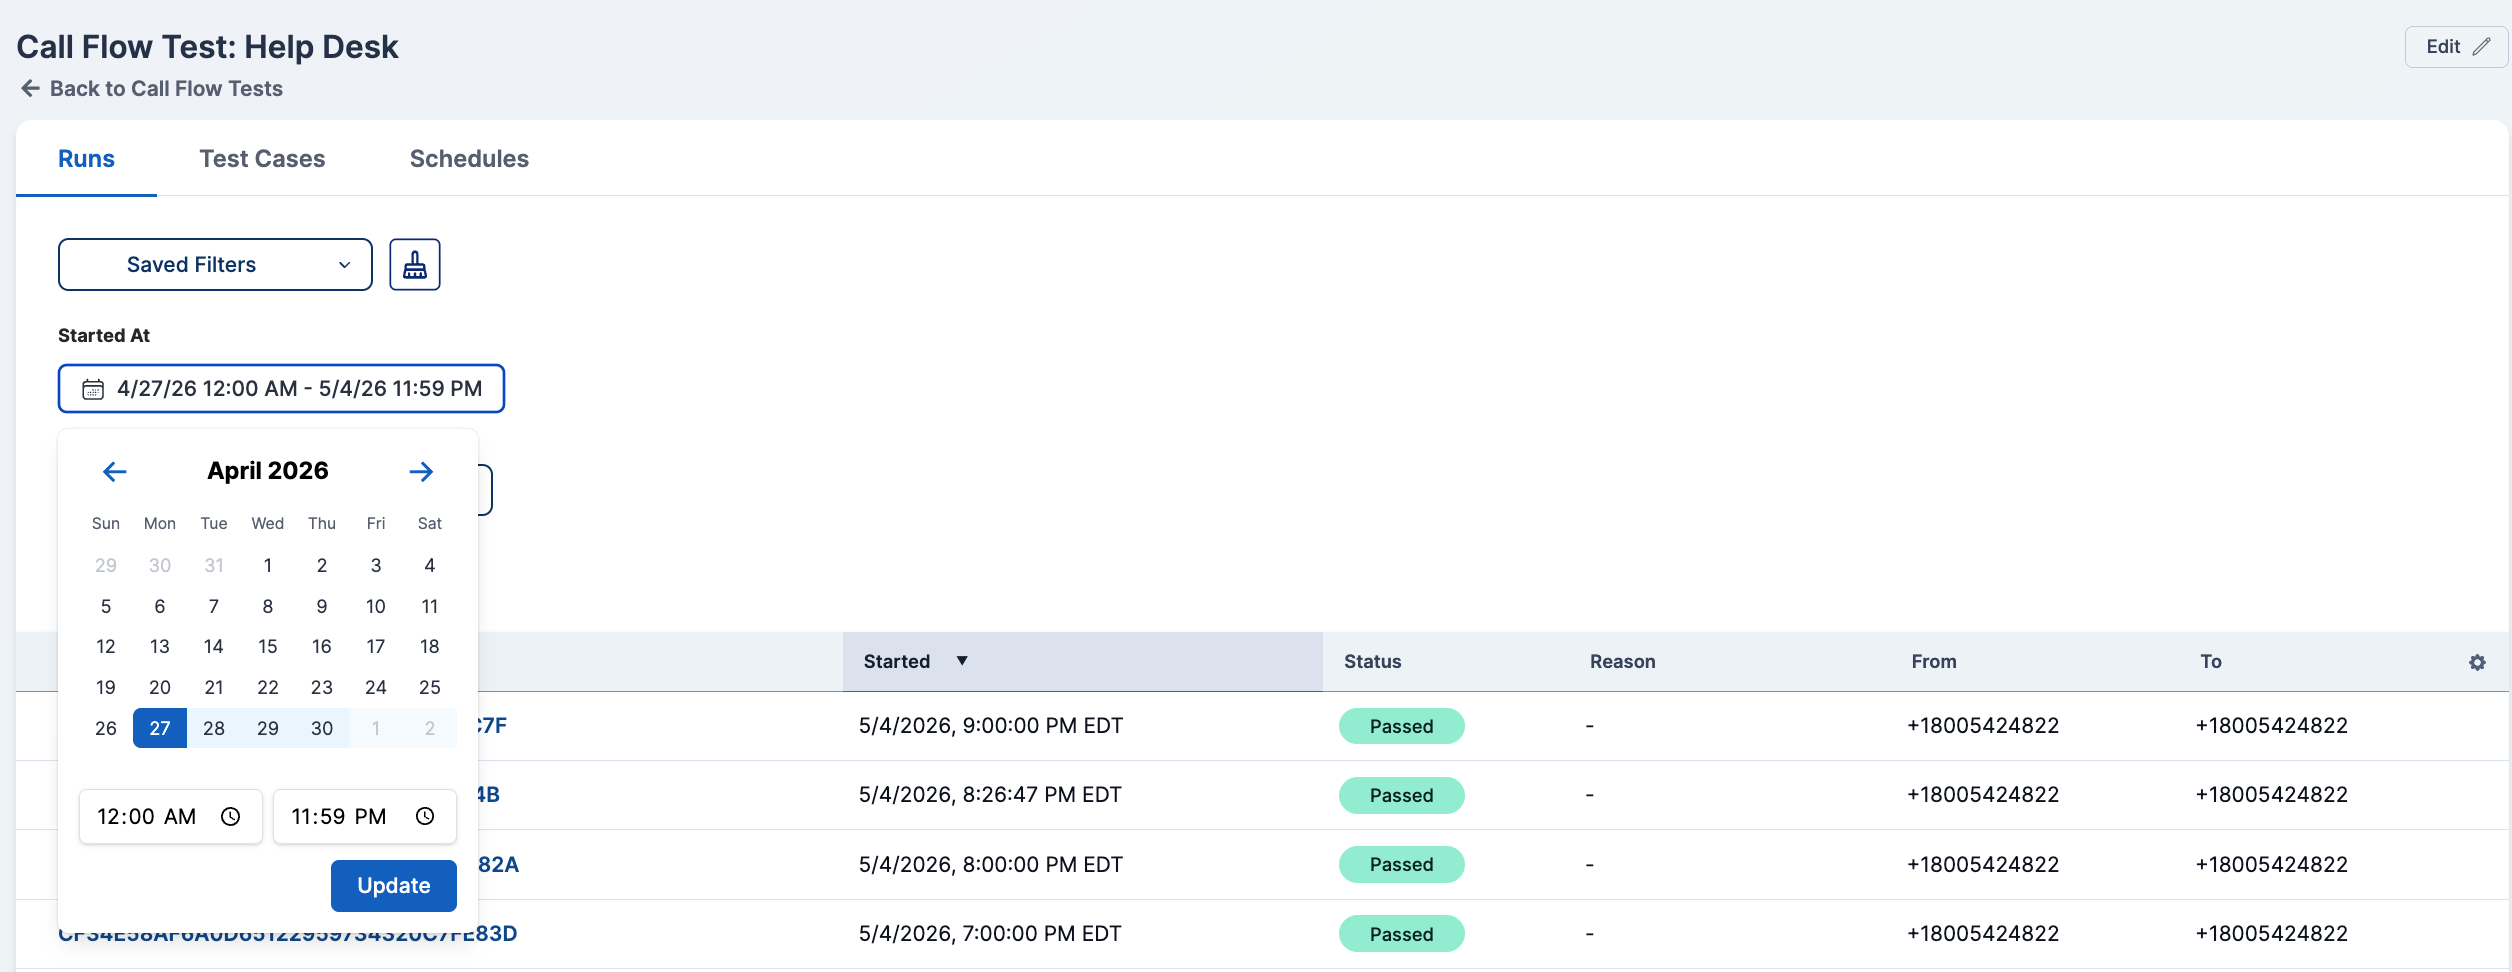
Filtering by Date Range
-
Locate the Started At date range control above the table.
-
Pick a start and end date. The control supports selecting times as well as dates, so you can narrow the window down to a specific hour. Once finished, click Update to confirm the date selection.
-
Review the table. The Runs tab reloads with only the runs that started within the selected window.
The date range resets to the last seven days each time you open the tab.
Sorting and Pagination
-
Click any sortable column header, such as Started or Status, to change the sort order. Click again to reverse the direction. A small arrow indicates the current sort.
-
Use the pagination controls at the bottom of the table to move between pages when a test has many runs in the selected window.

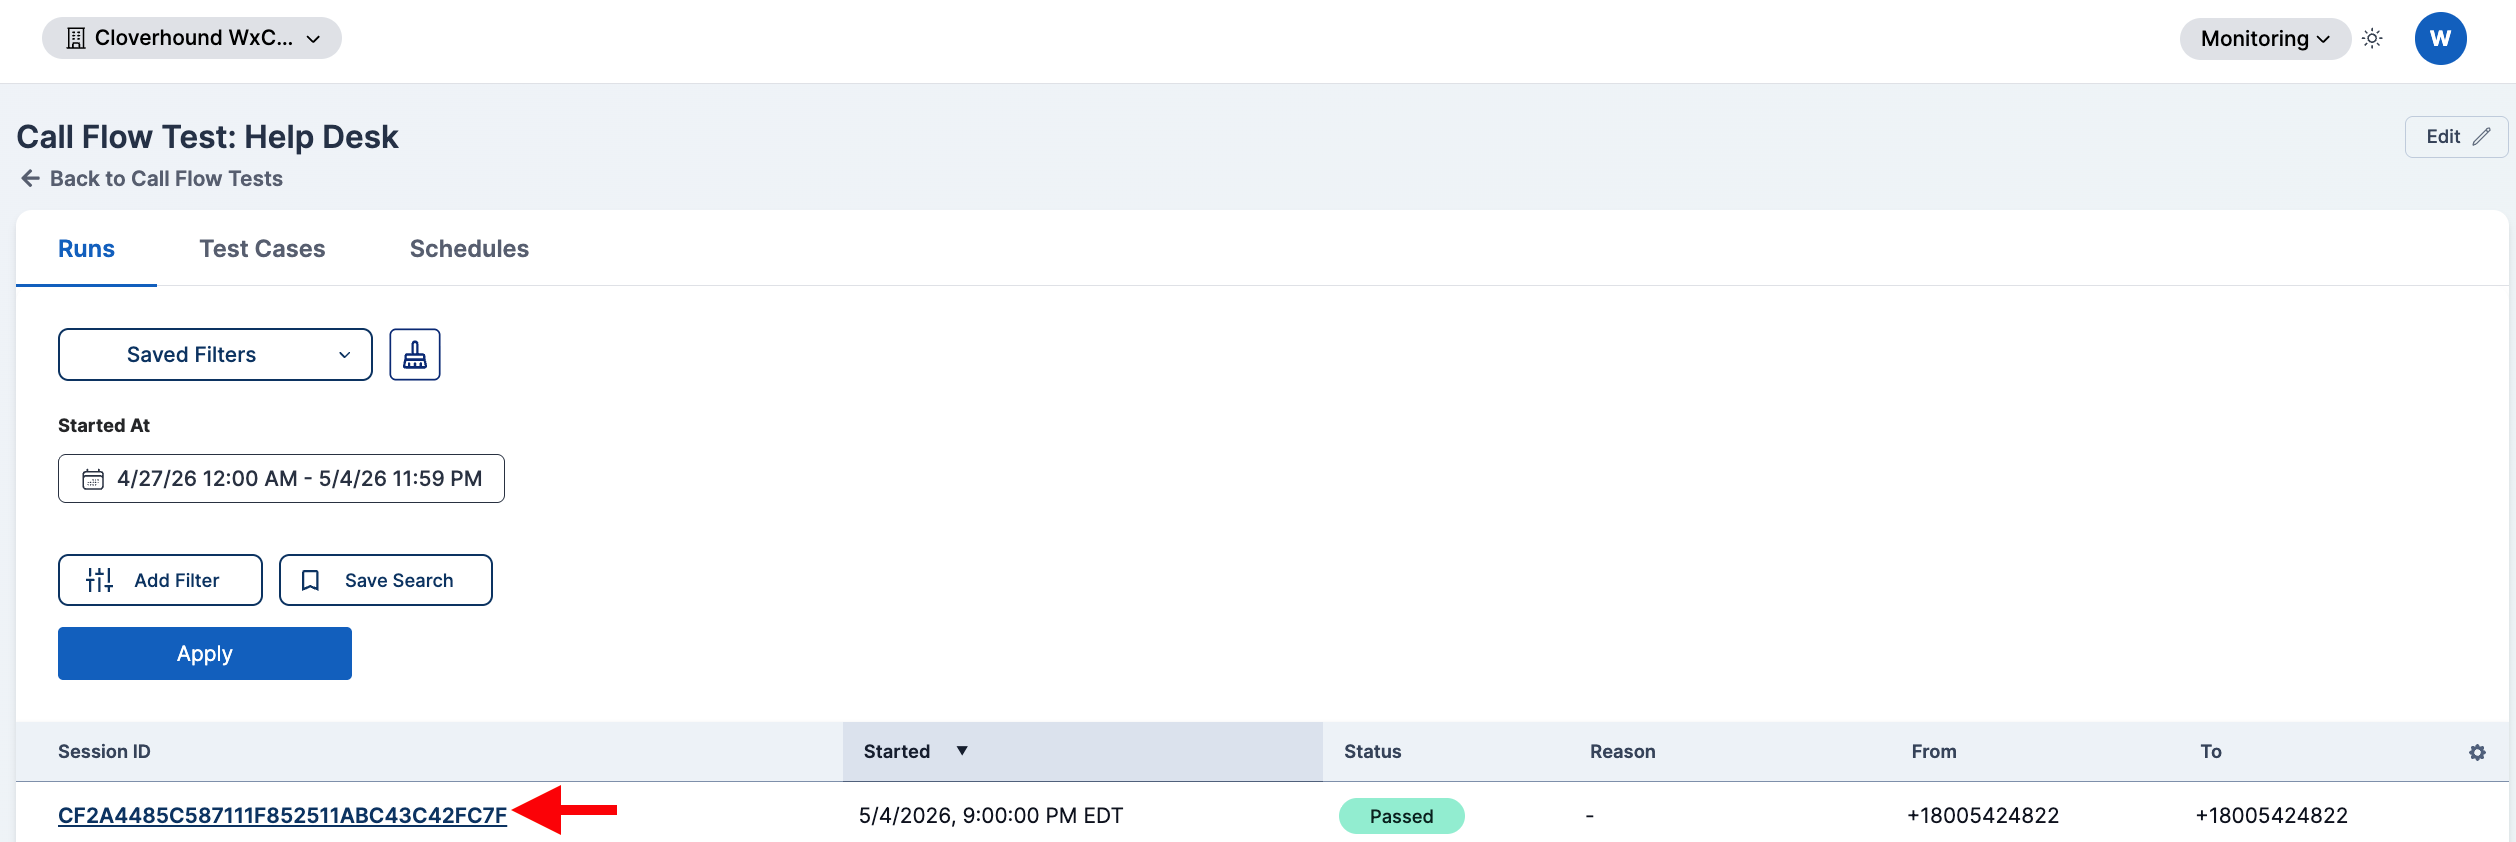
Opening a Run
-
Click the run's Session ID in the first column.
-
Review the run header. It shows the session ID, the run's status pill, and, for master administrators on completed runs, a Billing info button that opens the raw billing payload.
-
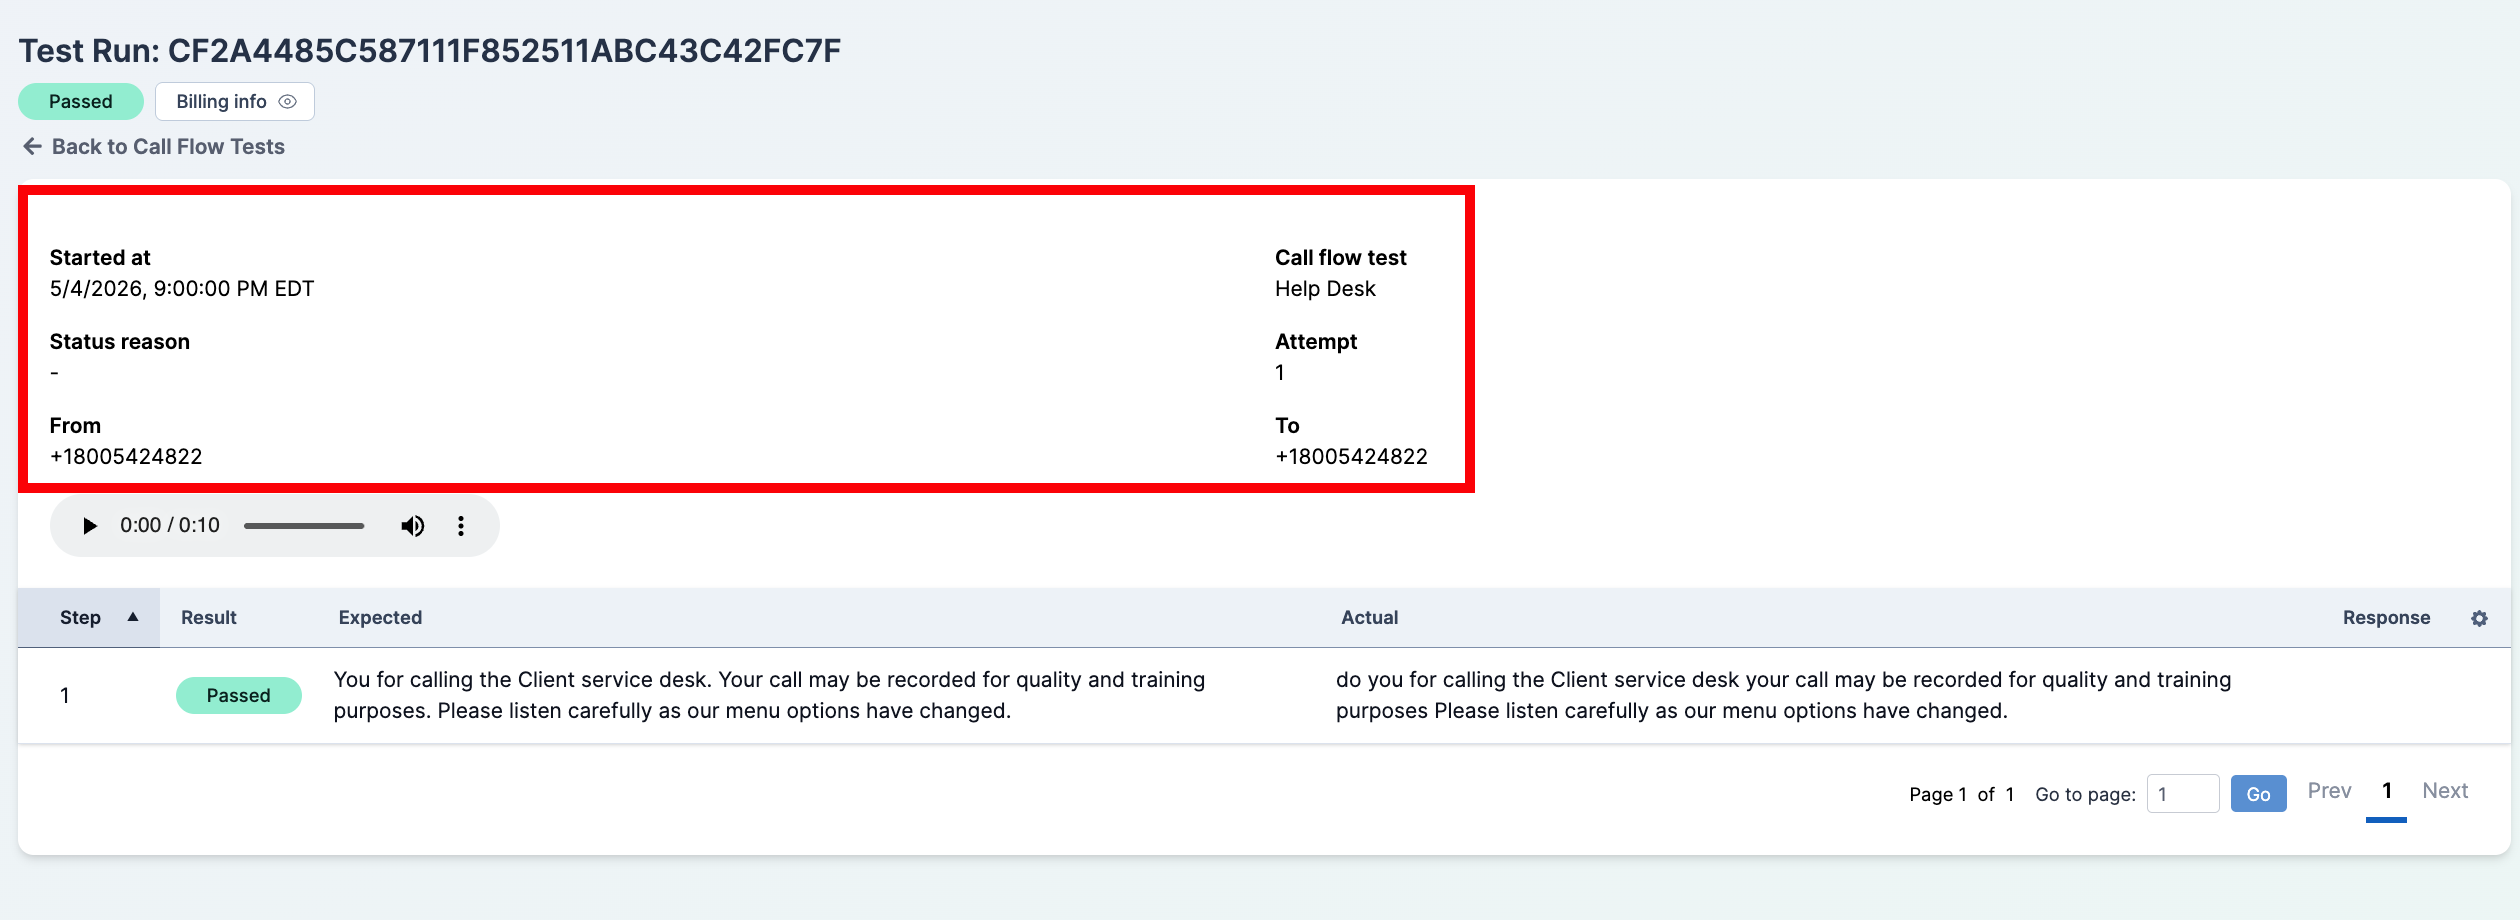
Review the summary panel. The run's detail page lists:
- Started at — when the run began.
- Call flow test — the parent Call Flow Test.
- Status reason — the same short code shown on the Runs tab, explaining a non-passing outcome.
- Attempt — which attempt this was. Cloverhound Cloud may retry transient failures; the attempt number increments with each retry.
- From — the source phone number used to place the call.
- To — the destination number that was called.
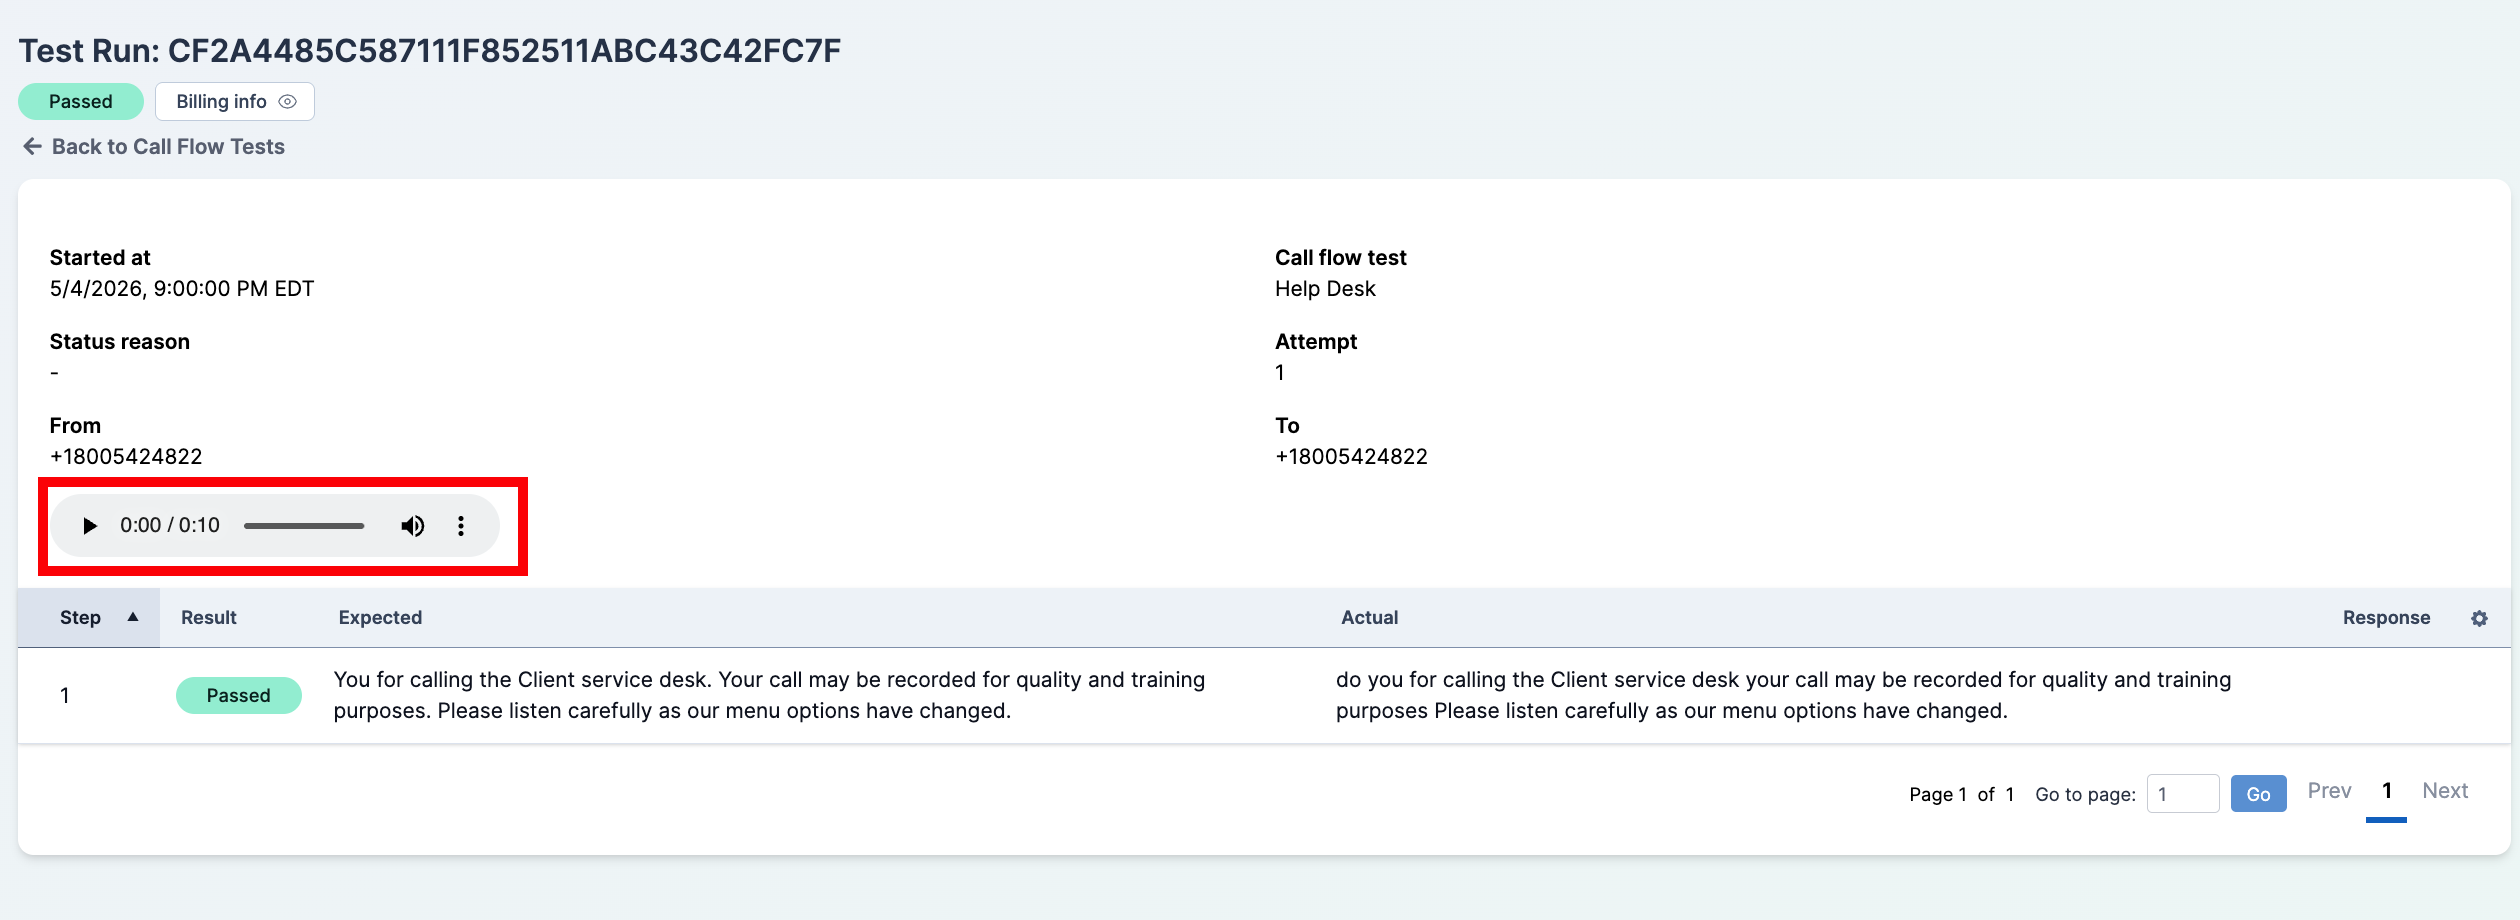
-
Play the audio recording at the top of the card, if one is available. The built-in player lets you listen to the full test call in place.
Reviewing Step Results
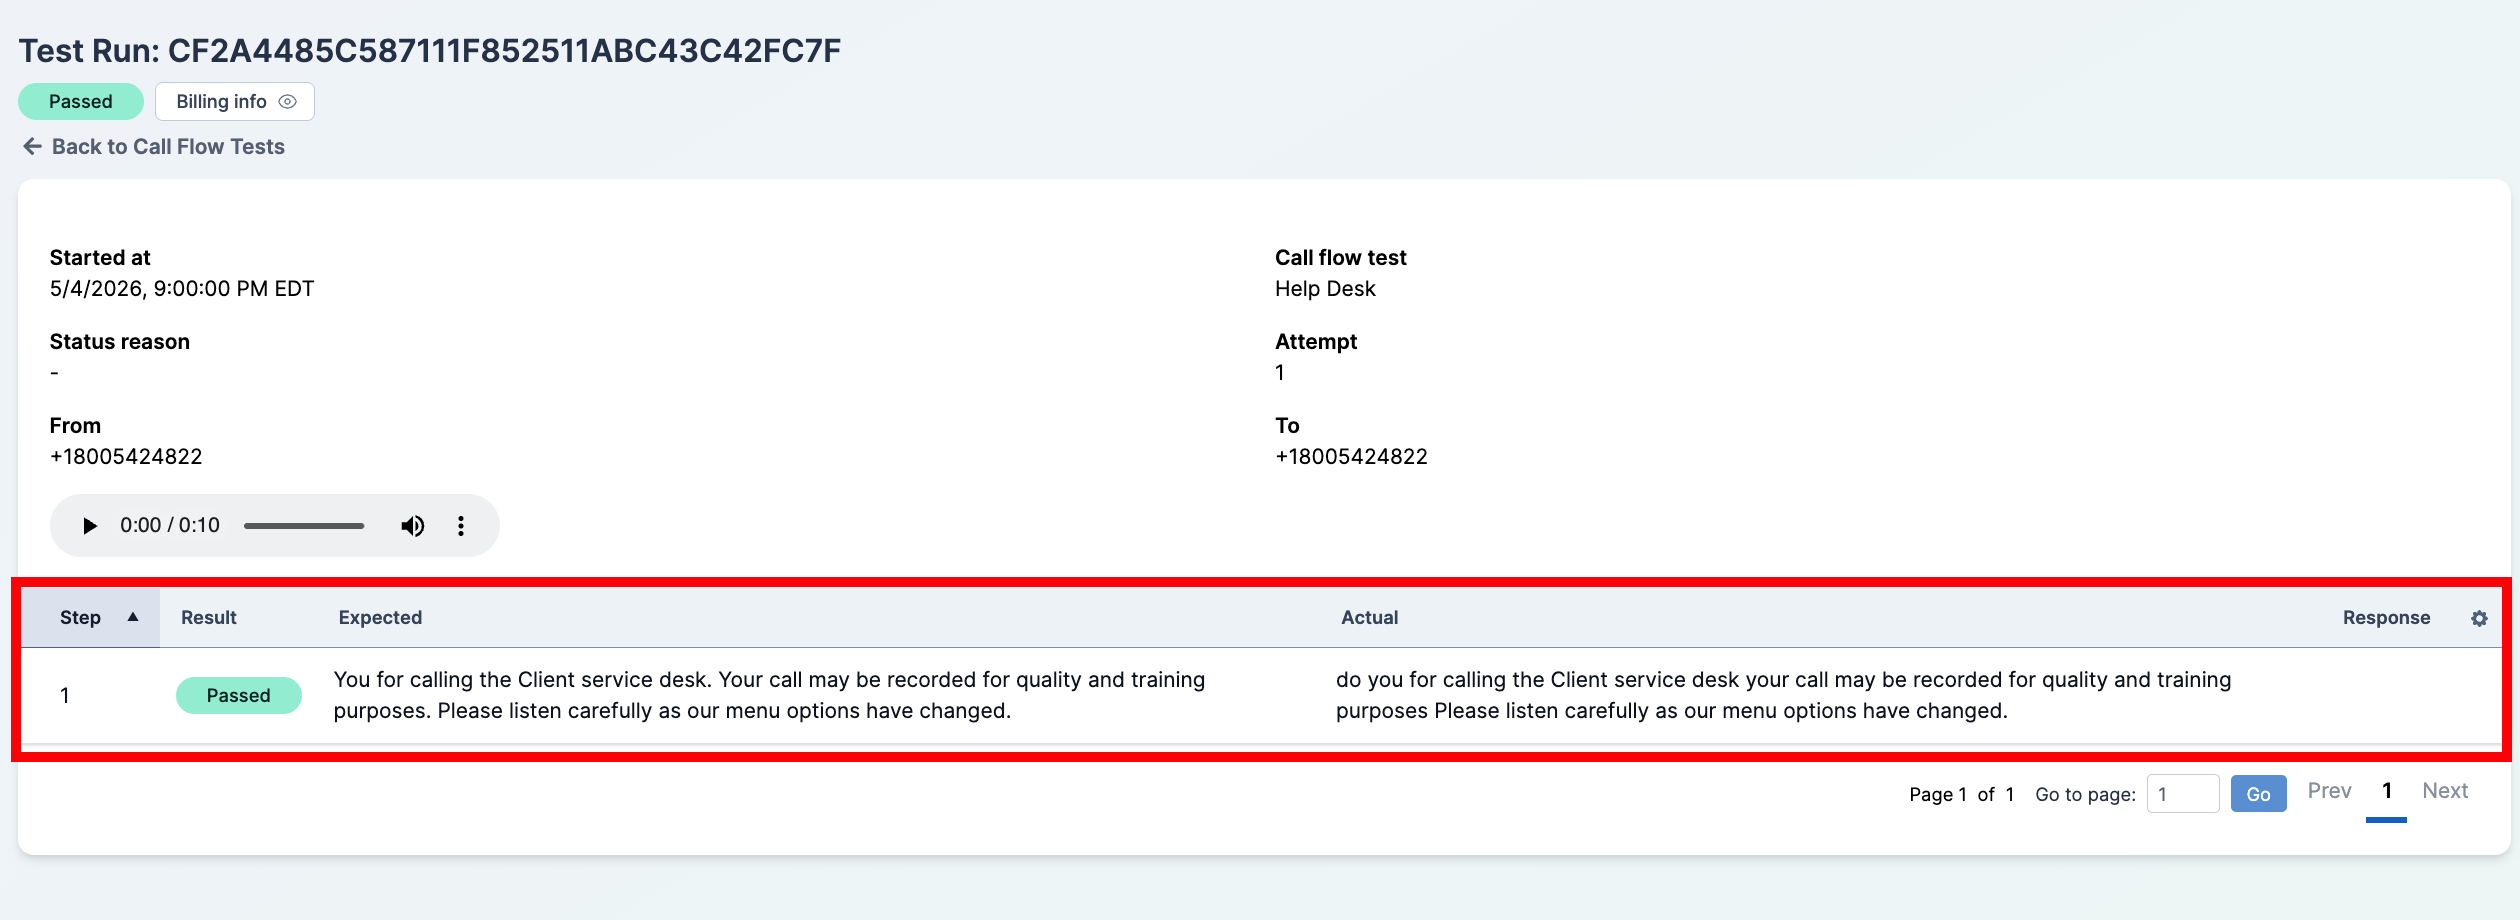
The run detail page also embeds a table of every step that executed during the run, in order.
-
Step — the sequence number of the step within the run.
-
Result — a Passed, Failed, or Running pill per step.
-
Expected — the response the step was configured to expect. An italic Any means the step passed without a specific match, and a blank means nothing was expected.
-
Actual — what the test actually heard. An italic Silence means the expected response was configured but nothing was captured, and None means no response was recorded at all.
-
Response — any input the tester sent during the step, such as DTMF digits.
Investigating a Failed Run
Start at the top of the Runs tab. The most recent failure is usually where to begin, and the Reason column often tells you immediately whether the failure was a dialing problem (call_no_answer, call_busy, call_failed_*), an IVR problem (wrong_message, early_hangup, message_timeout), or an internal cancel.
- Open the failing run by clicking its Session ID.
- Check the Status reason in the summary panel for a machine-readable cause.
- Play the recording, if present, to hear what actually happened on the call.
- Scan the embedded Steps table for the first step with a Failed result and compare its Expected and Actual values.
With the Runs tab, you can confirm that a Call Flow Test is healthy, pinpoint when and how a failure occurred, and play back the exact call the tester placed on your behalf.