Building a Dashboard
A dashboard is a grid of panels. You choose what each panel measures, drag it into place, resize it, and tune how it looks. This page walks through creating a dashboard, adding and configuring panels, saving, and going back to an earlier version.
To see what the finished result looks like, open one of the templates on the Templates tab first. If a template is close to what you need, cloning it is usually faster than starting from scratch. See Sharing Dashboards and Using Templates.
Creating a Dashboard
Organization administrators can create a dashboard from scratch. Other members can clone an existing dashboard or template and edit their copy.
-
Navigate to the Dashboards module and open the Dashboards page.
-
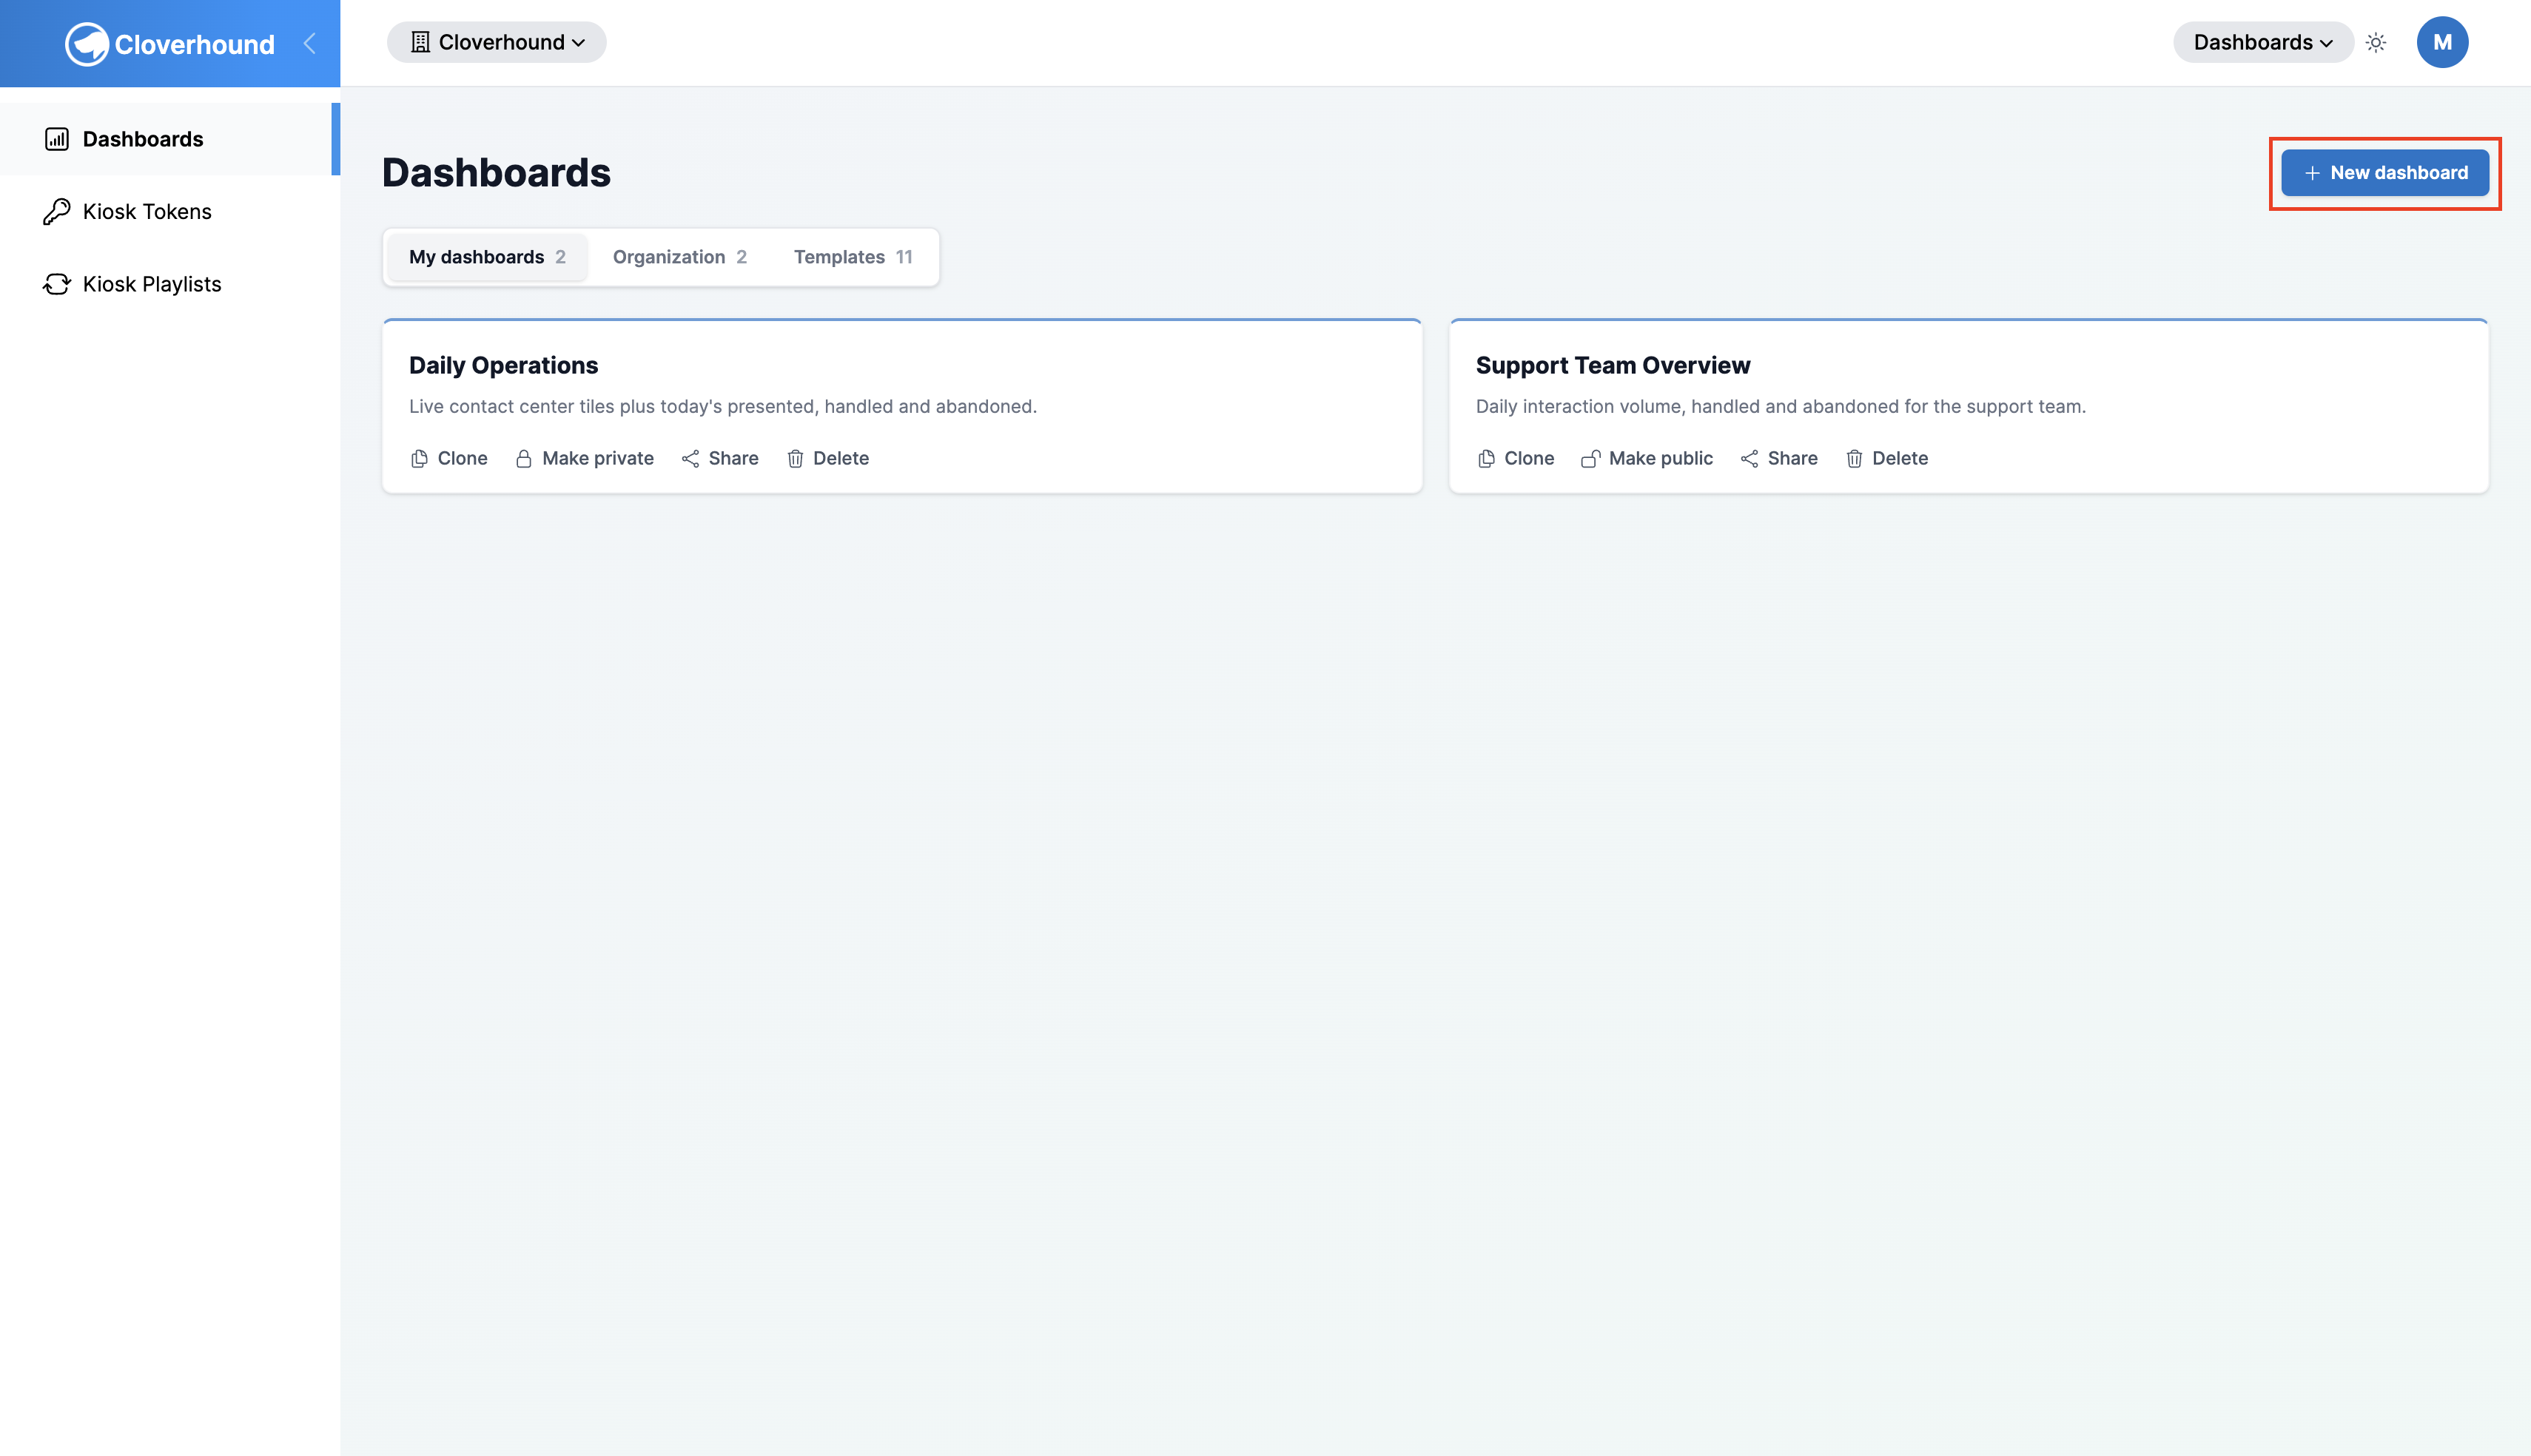
Click New dashboard.
-
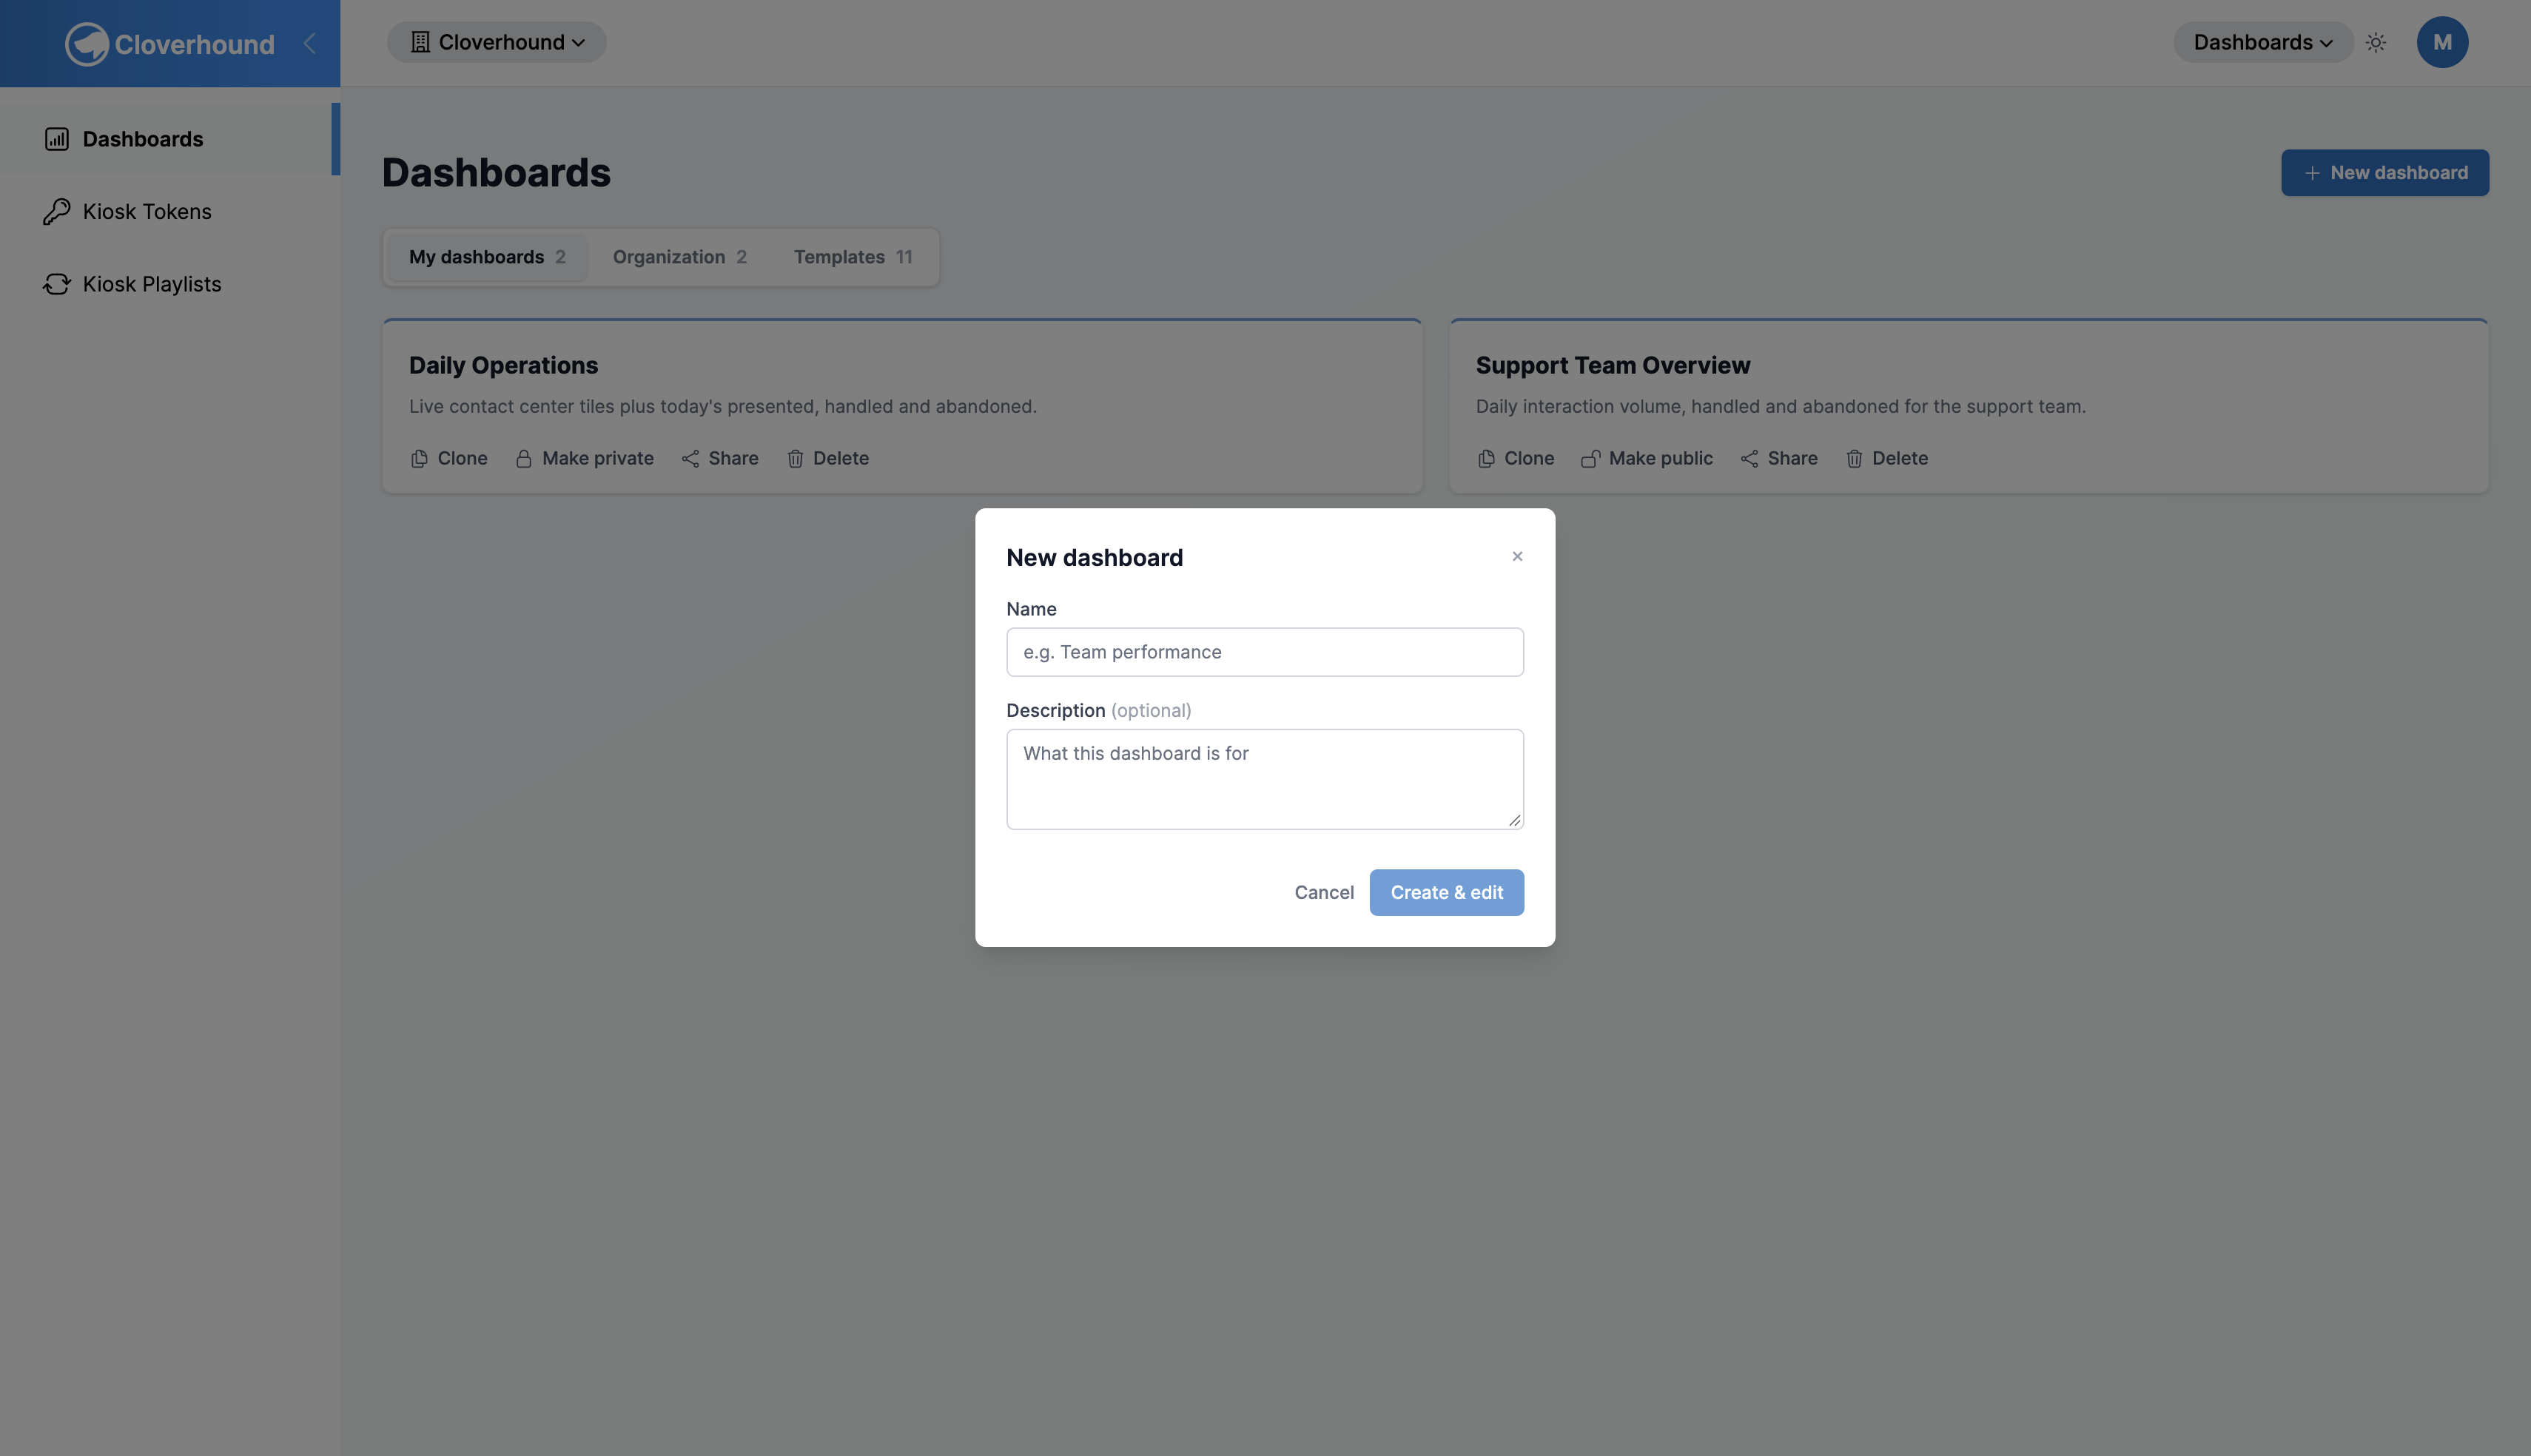
Enter a Name. The name is required. Optionally add a Description.
-
Click Create & edit. Cloverhound Cloud opens the editor with an empty dashboard.
The name cannot be changed from inside the editor, so choose it carefully. A new dashboard is Personal: only you can see it until you share it.
The Editor
The editor shows your panels on a grid. Along the top you will find:
| Control | What it does |
|---|---|
| Back to dashboard | Leaves the editor and returns to the dashboard view. |
| Add panel | Opens the dialog for adding a panel. |
| History | Opens the list of earlier versions. |
| Live preview: off / on | Turns live data on or off in the panels while you edit. Nothing is saved by the preview. |
| Reset | Discards the changes you have not saved. |
| Save | Saves your changes. Available only when there is something to save. |
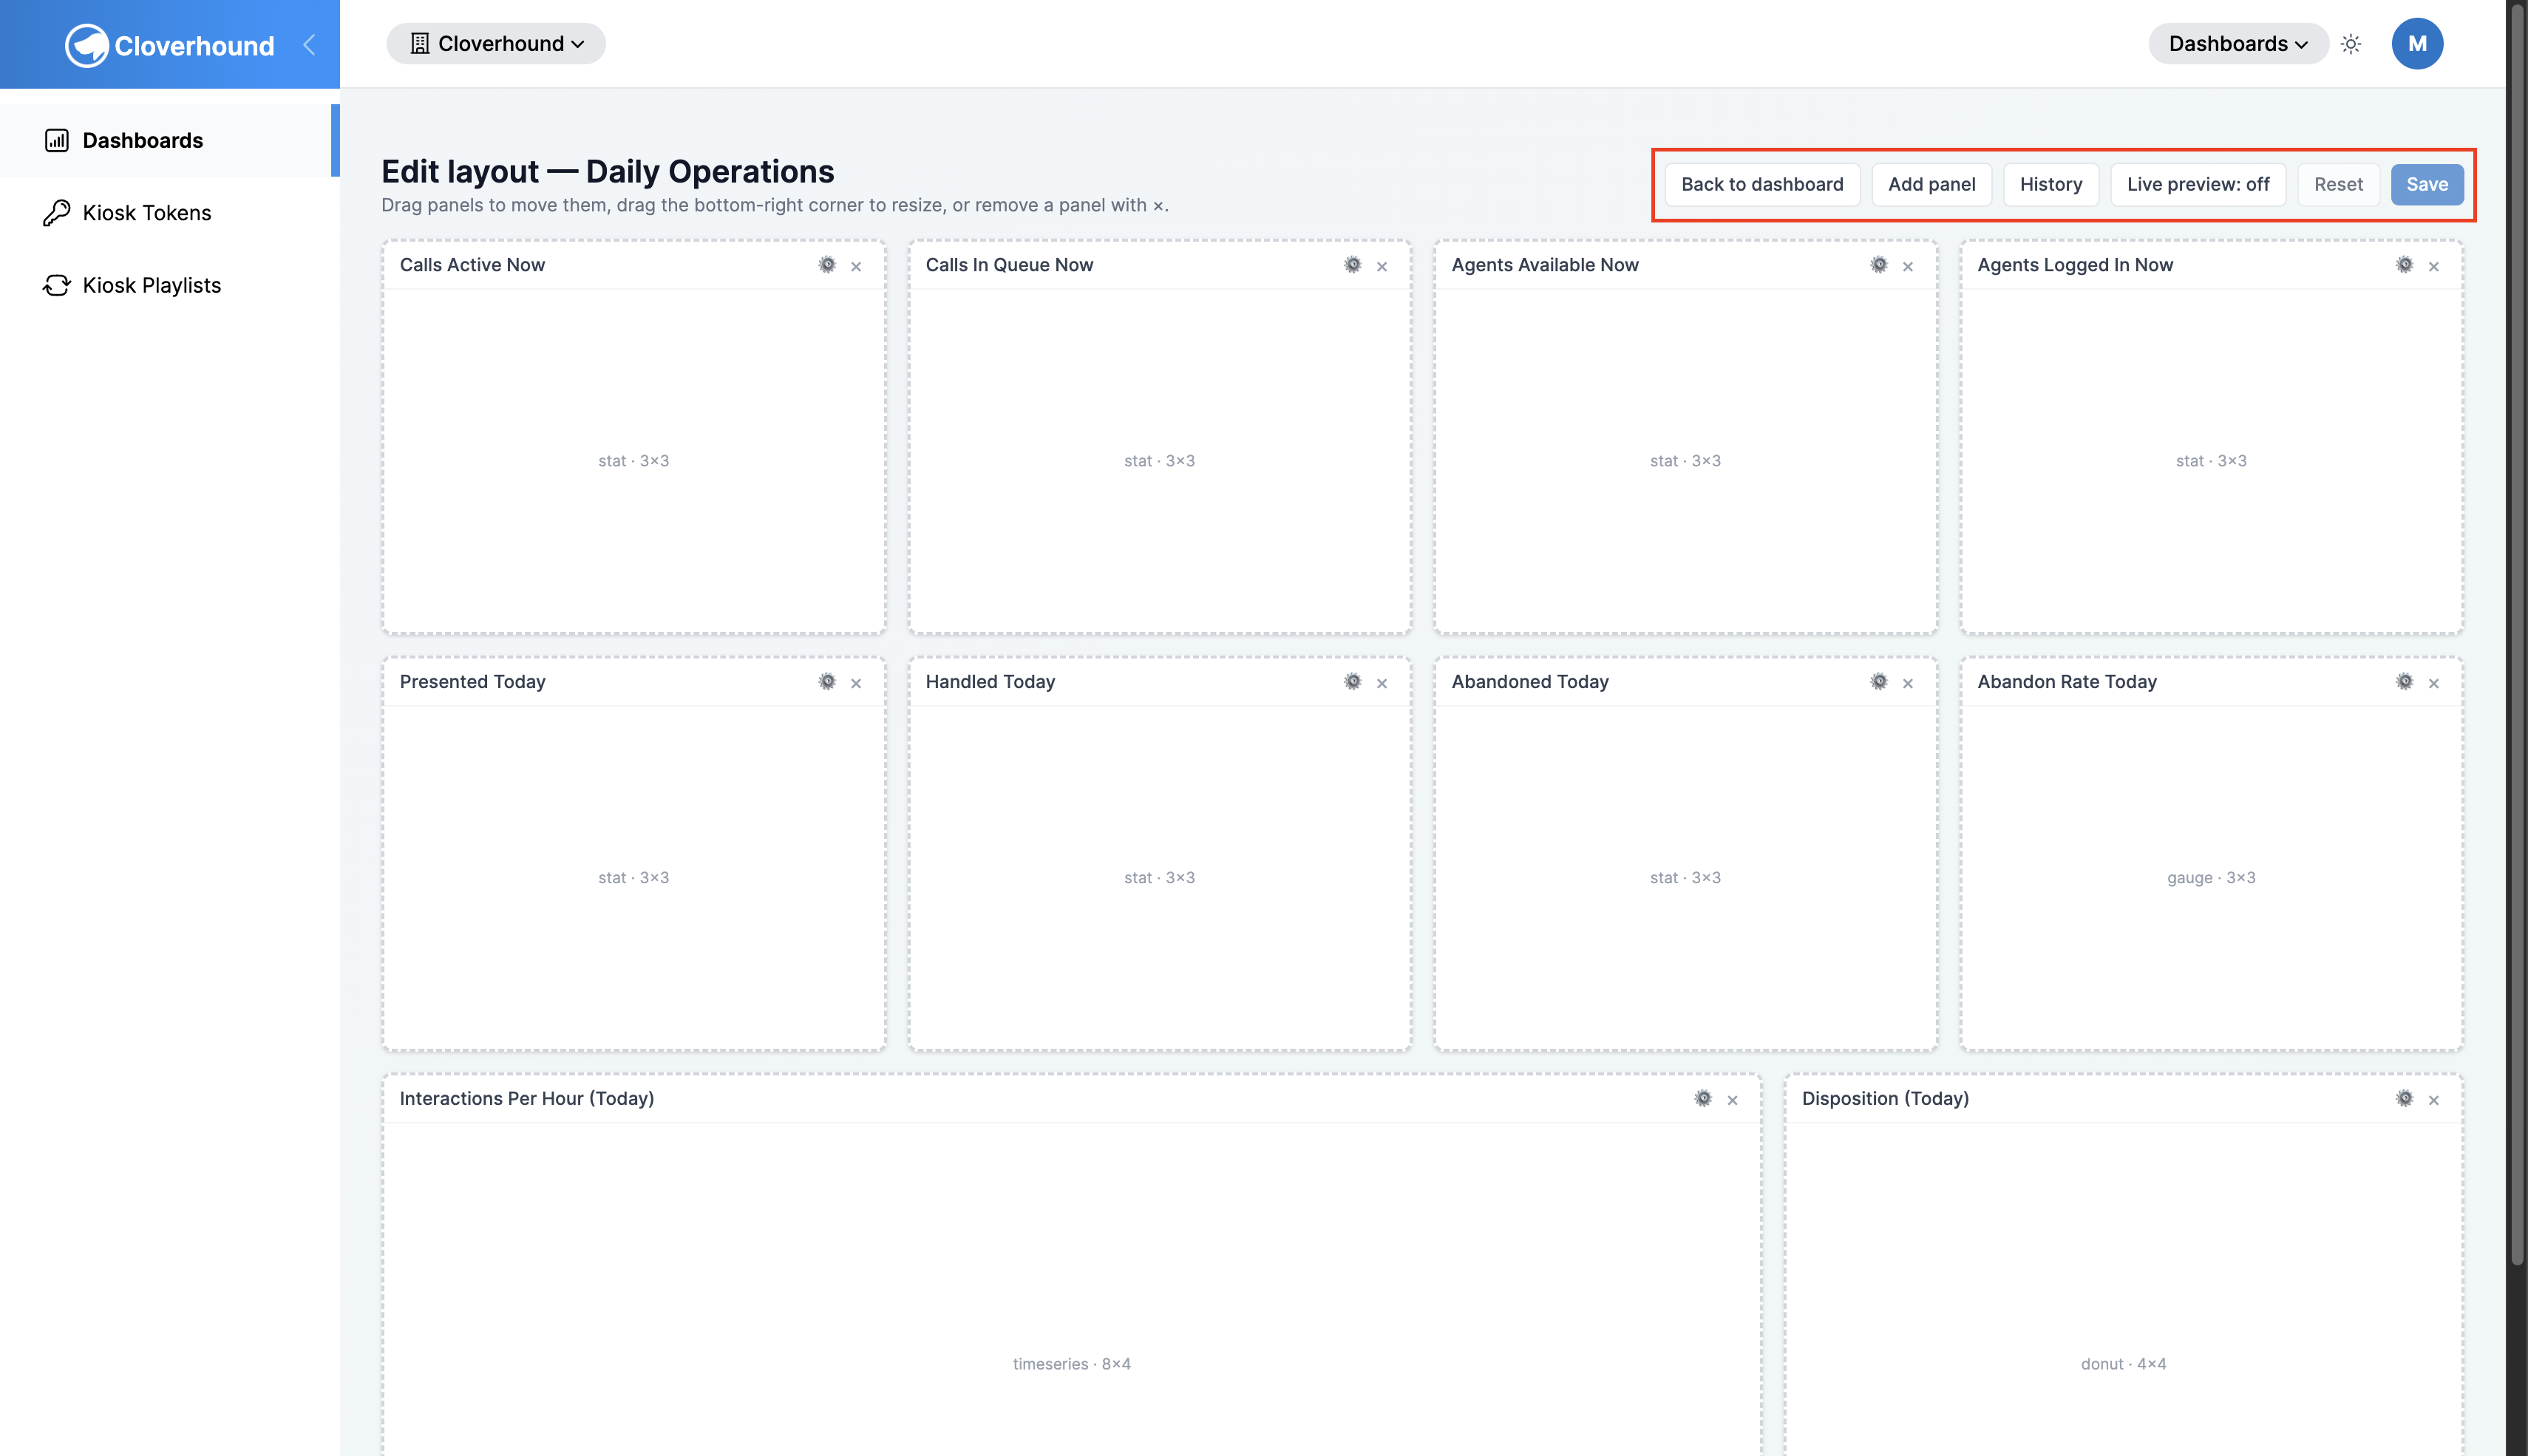
Each panel on the grid shows its title, the Edit options icon, a remove icon, and, at the bottom, its type and size in grid cells (for example, stat · 4×3).
- Move a panel by dragging it to a new position.
- Resize a panel by dragging the handle at its bottom-right corner.
- Remove a panel with its remove icon.
Adding a Panel
-
Click Add panel.
-
Choose a Panel type. For the types and what each one shows, see Panel Types.
-
Choose a Dataset. The list only shows datasets that work with the panel type you picked.
-
Check at least one Measure. Measures are the numbers the panel calculates, such as Count or Abandon Rate.
-
Check any Dimensions you want to break the numbers down by, such as Channel or Result. Dimensions are optional.
-
Enter a Title, or leave it blank to use the suggested one.
-
Click Add panel at the bottom of the dialog.
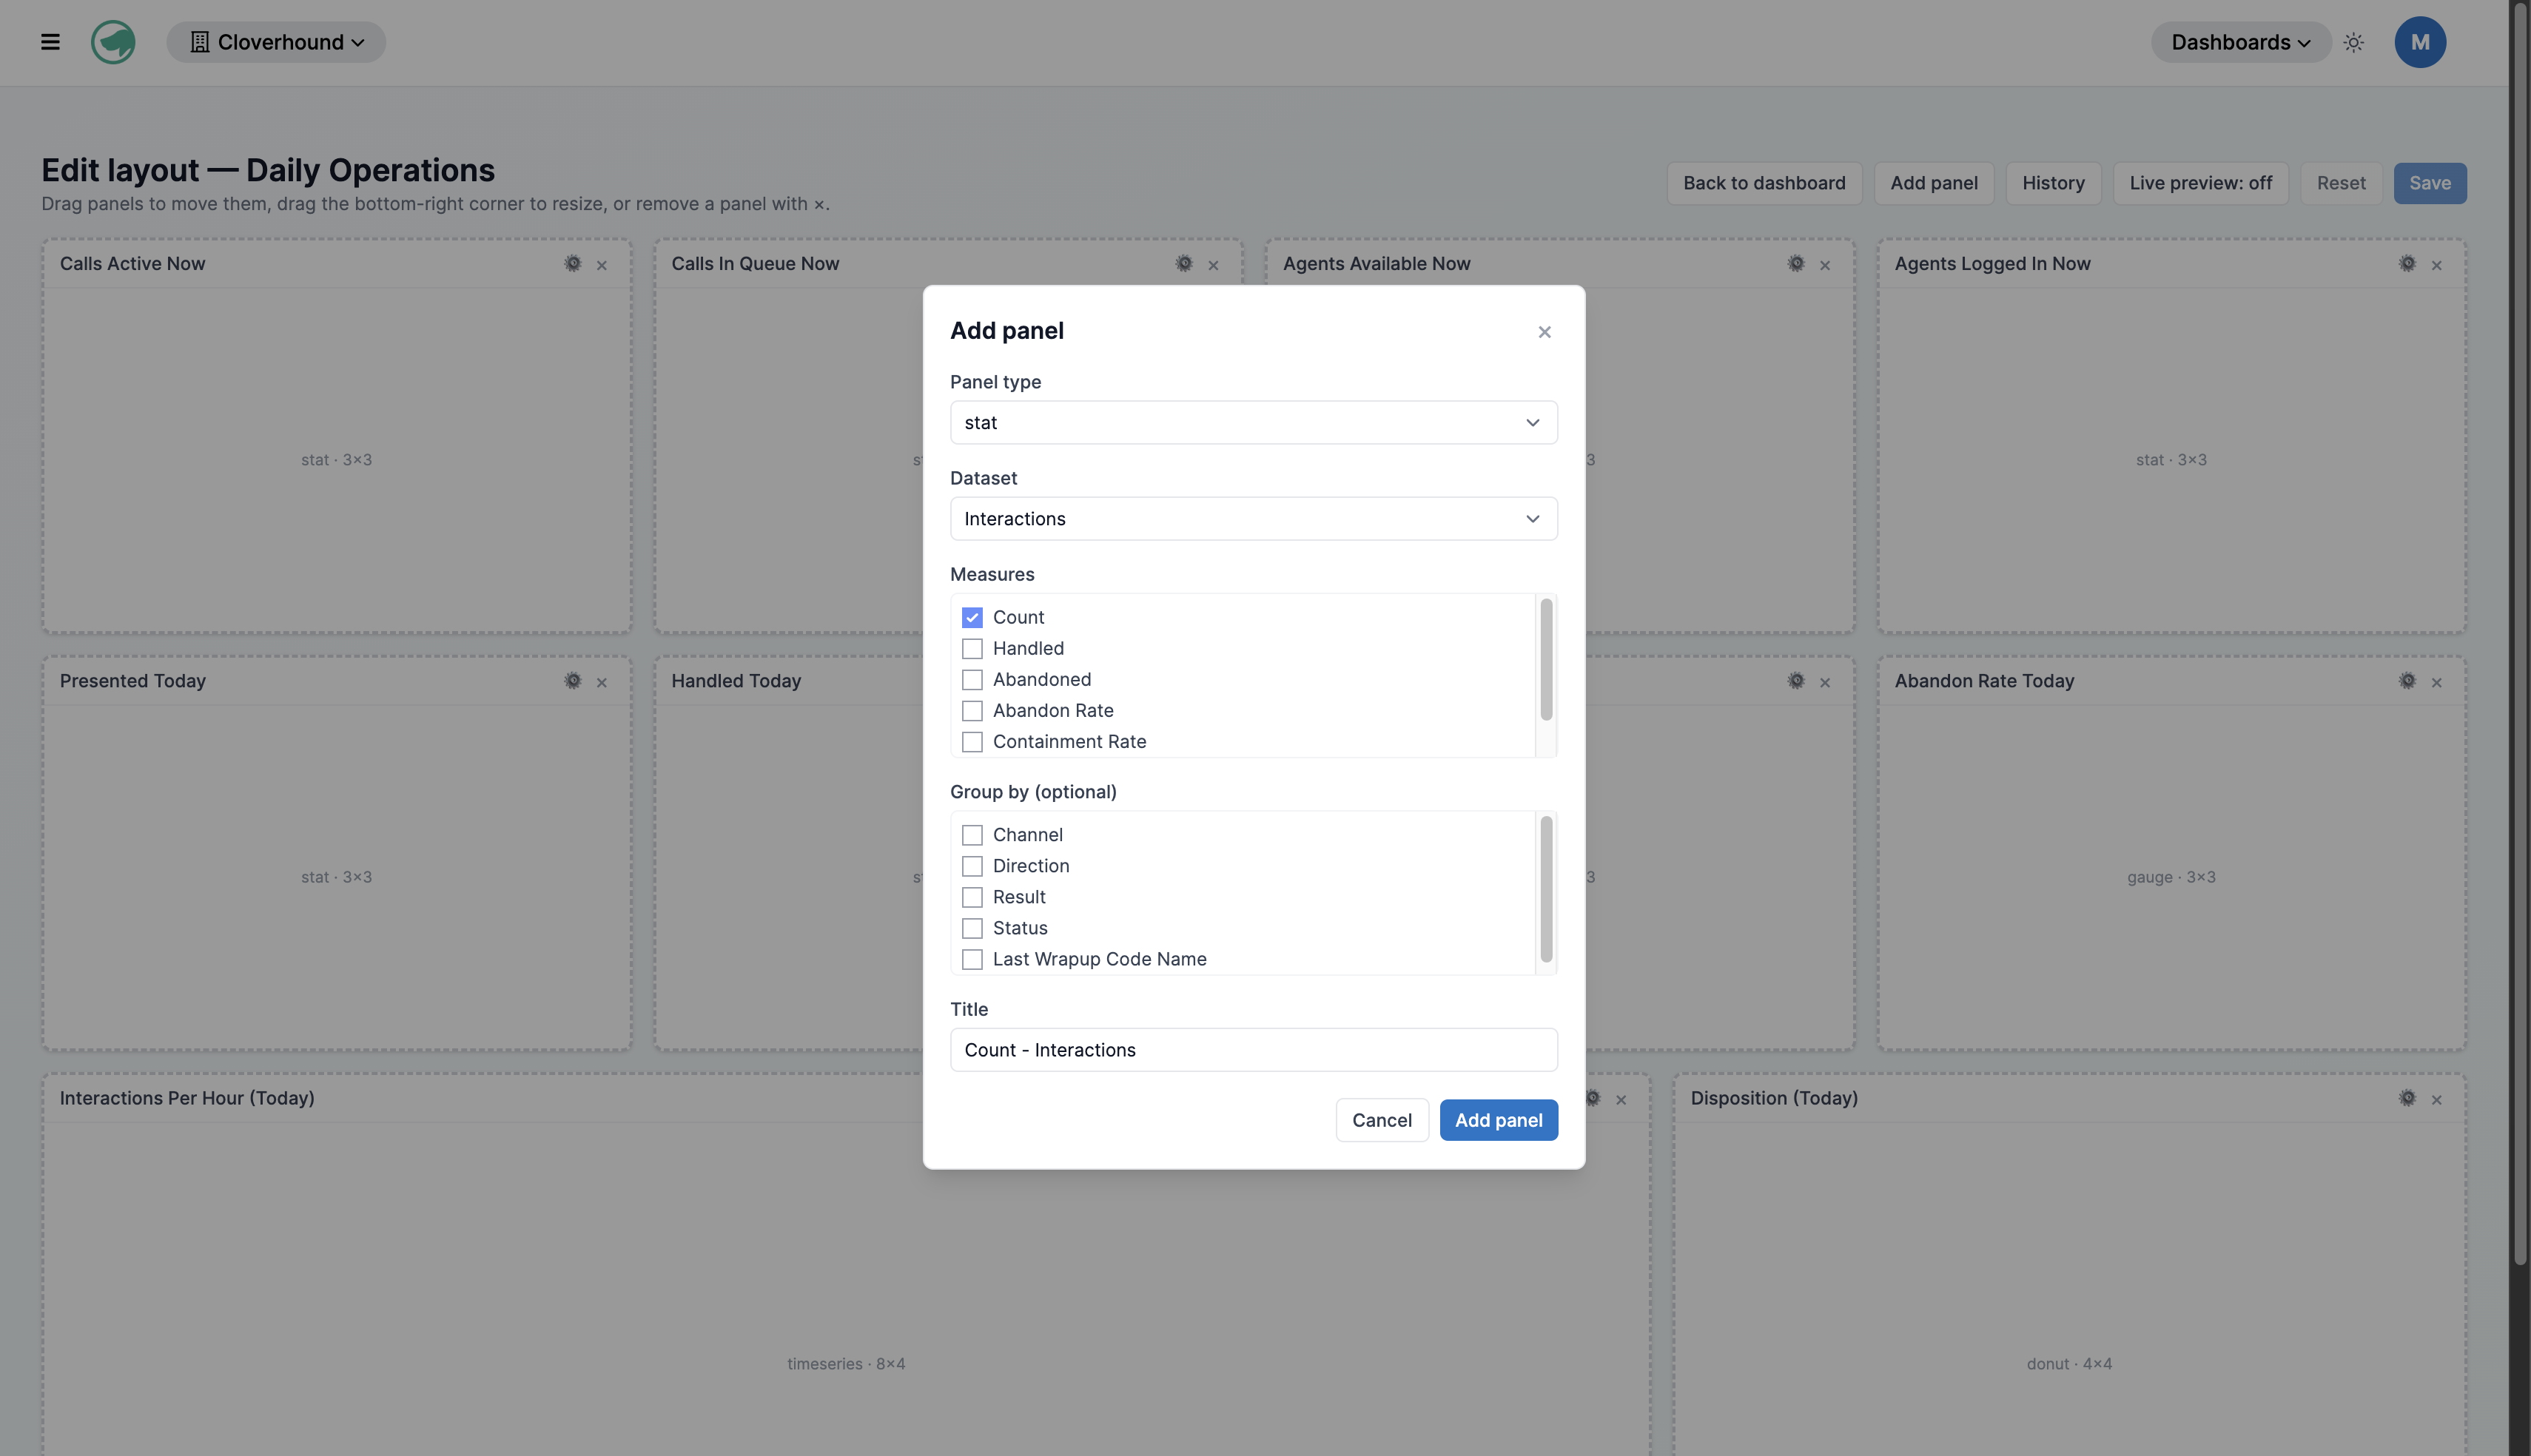
A Stat panel shows a single number. For a stat, choose one measure and no dimensions. If you add a dimension, the panel displays the first group instead of a total.
Datasets
Datasets come in two kinds.
- Historical datasets cover a time range: Interactions, Flow Interactions, Agent Sessions, Agent States, Queue Events, Flow Steps, Test Runs, and Test Run Steps. They work with Stat, Gauge, Table, Donut, and Time series panels.
- Live datasets show the current state and have no time range: Org Snapshot, Queue Snapshot, Agent State Snapshot, and Agent Snapshot. They work with Stat and Gauge, plus Table and Donut (except Org Snapshot), Board (queue, agent state, and agent datasets), and Agent grid (Agent Snapshot only).
Once a panel is added, you cannot change its dataset, measures, or dimensions. To change them, remove the panel and add it again.
Editing Panel Options
Options change how a panel looks, not what it measures.
-
Click the Edit options icon on a panel.
-
Change the Title or any option for that panel type.
-
Click Apply, or Cancel to close without changes.
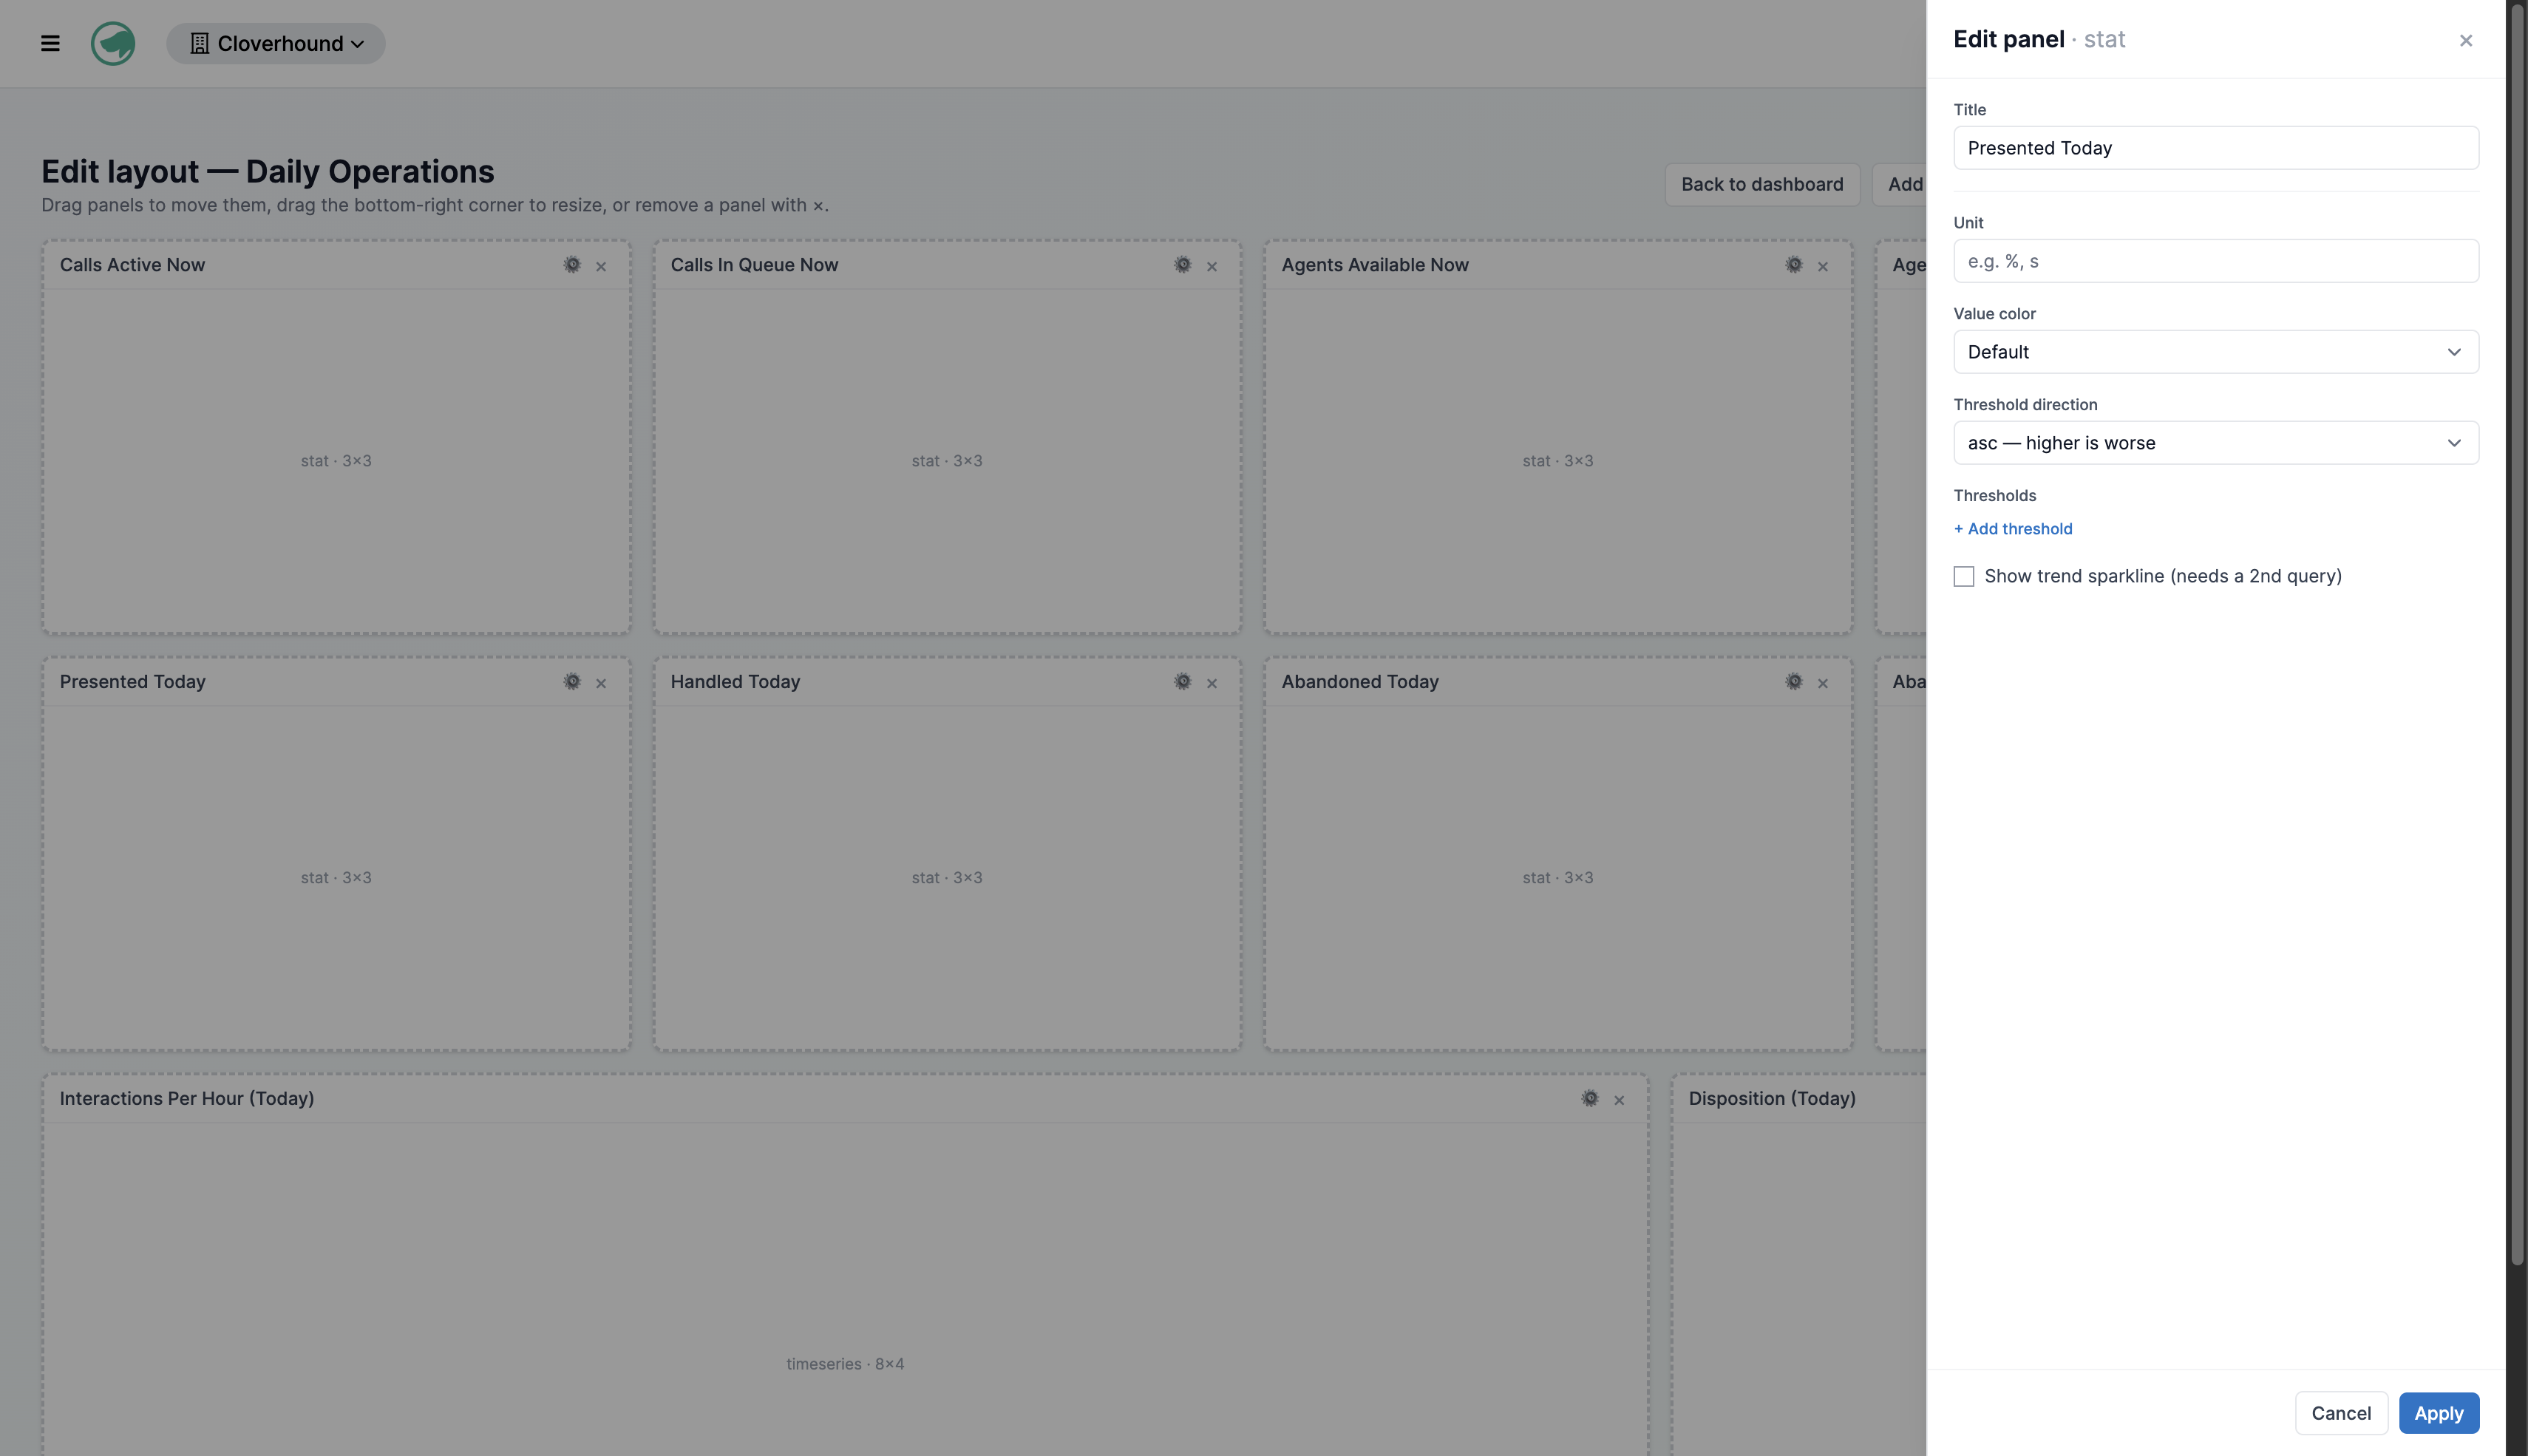
The options depend on the panel type.
| Panel type | Options |
|---|---|
| Stat | Unit, Value color, Threshold direction, Thresholds |
| Gauge | Min, Max, Unit, Threshold direction, Thresholds |
| Time series | Display (Line or Bar), Stacked, Area fill, Show legend, Series colors, Reference lines, Comparison overlay (None, Yesterday, Last week) |
| Donut | Slice colors, Show legend, Show slice labels, Label content, Show total in center, Unit |
| Table | Columns, Default sort column, Sort direction, Page size (max rows) |
| Board | Density (Comfortable (wallboard) or Compact), Columns, Thresholds |
| Agent grid | Group state and idle-code tiles, Columns (blank = auto-fit) |
Thresholds
Thresholds color a value when it crosses a limit, so a problem stands out at a glance. Each threshold is a value and a color. Use Threshold direction to say which way is worse: asc means a higher number is worse, desc means a lower number is worse. On a Board, each threshold is tied to a specific measure.
Saving Your Work
- Click Save. The page confirms with Layout saved.
Unsaved changes are lost if you leave the editor. Reset throws away everything since your last save.
If someone else saved the dashboard while you were editing, the editor warns you: This dashboard was edited elsewhere. Reload to get the latest version. You can then choose:
- Reload to discard your changes and load the latest version.
- Keep my changes to save your version over theirs.
Version History
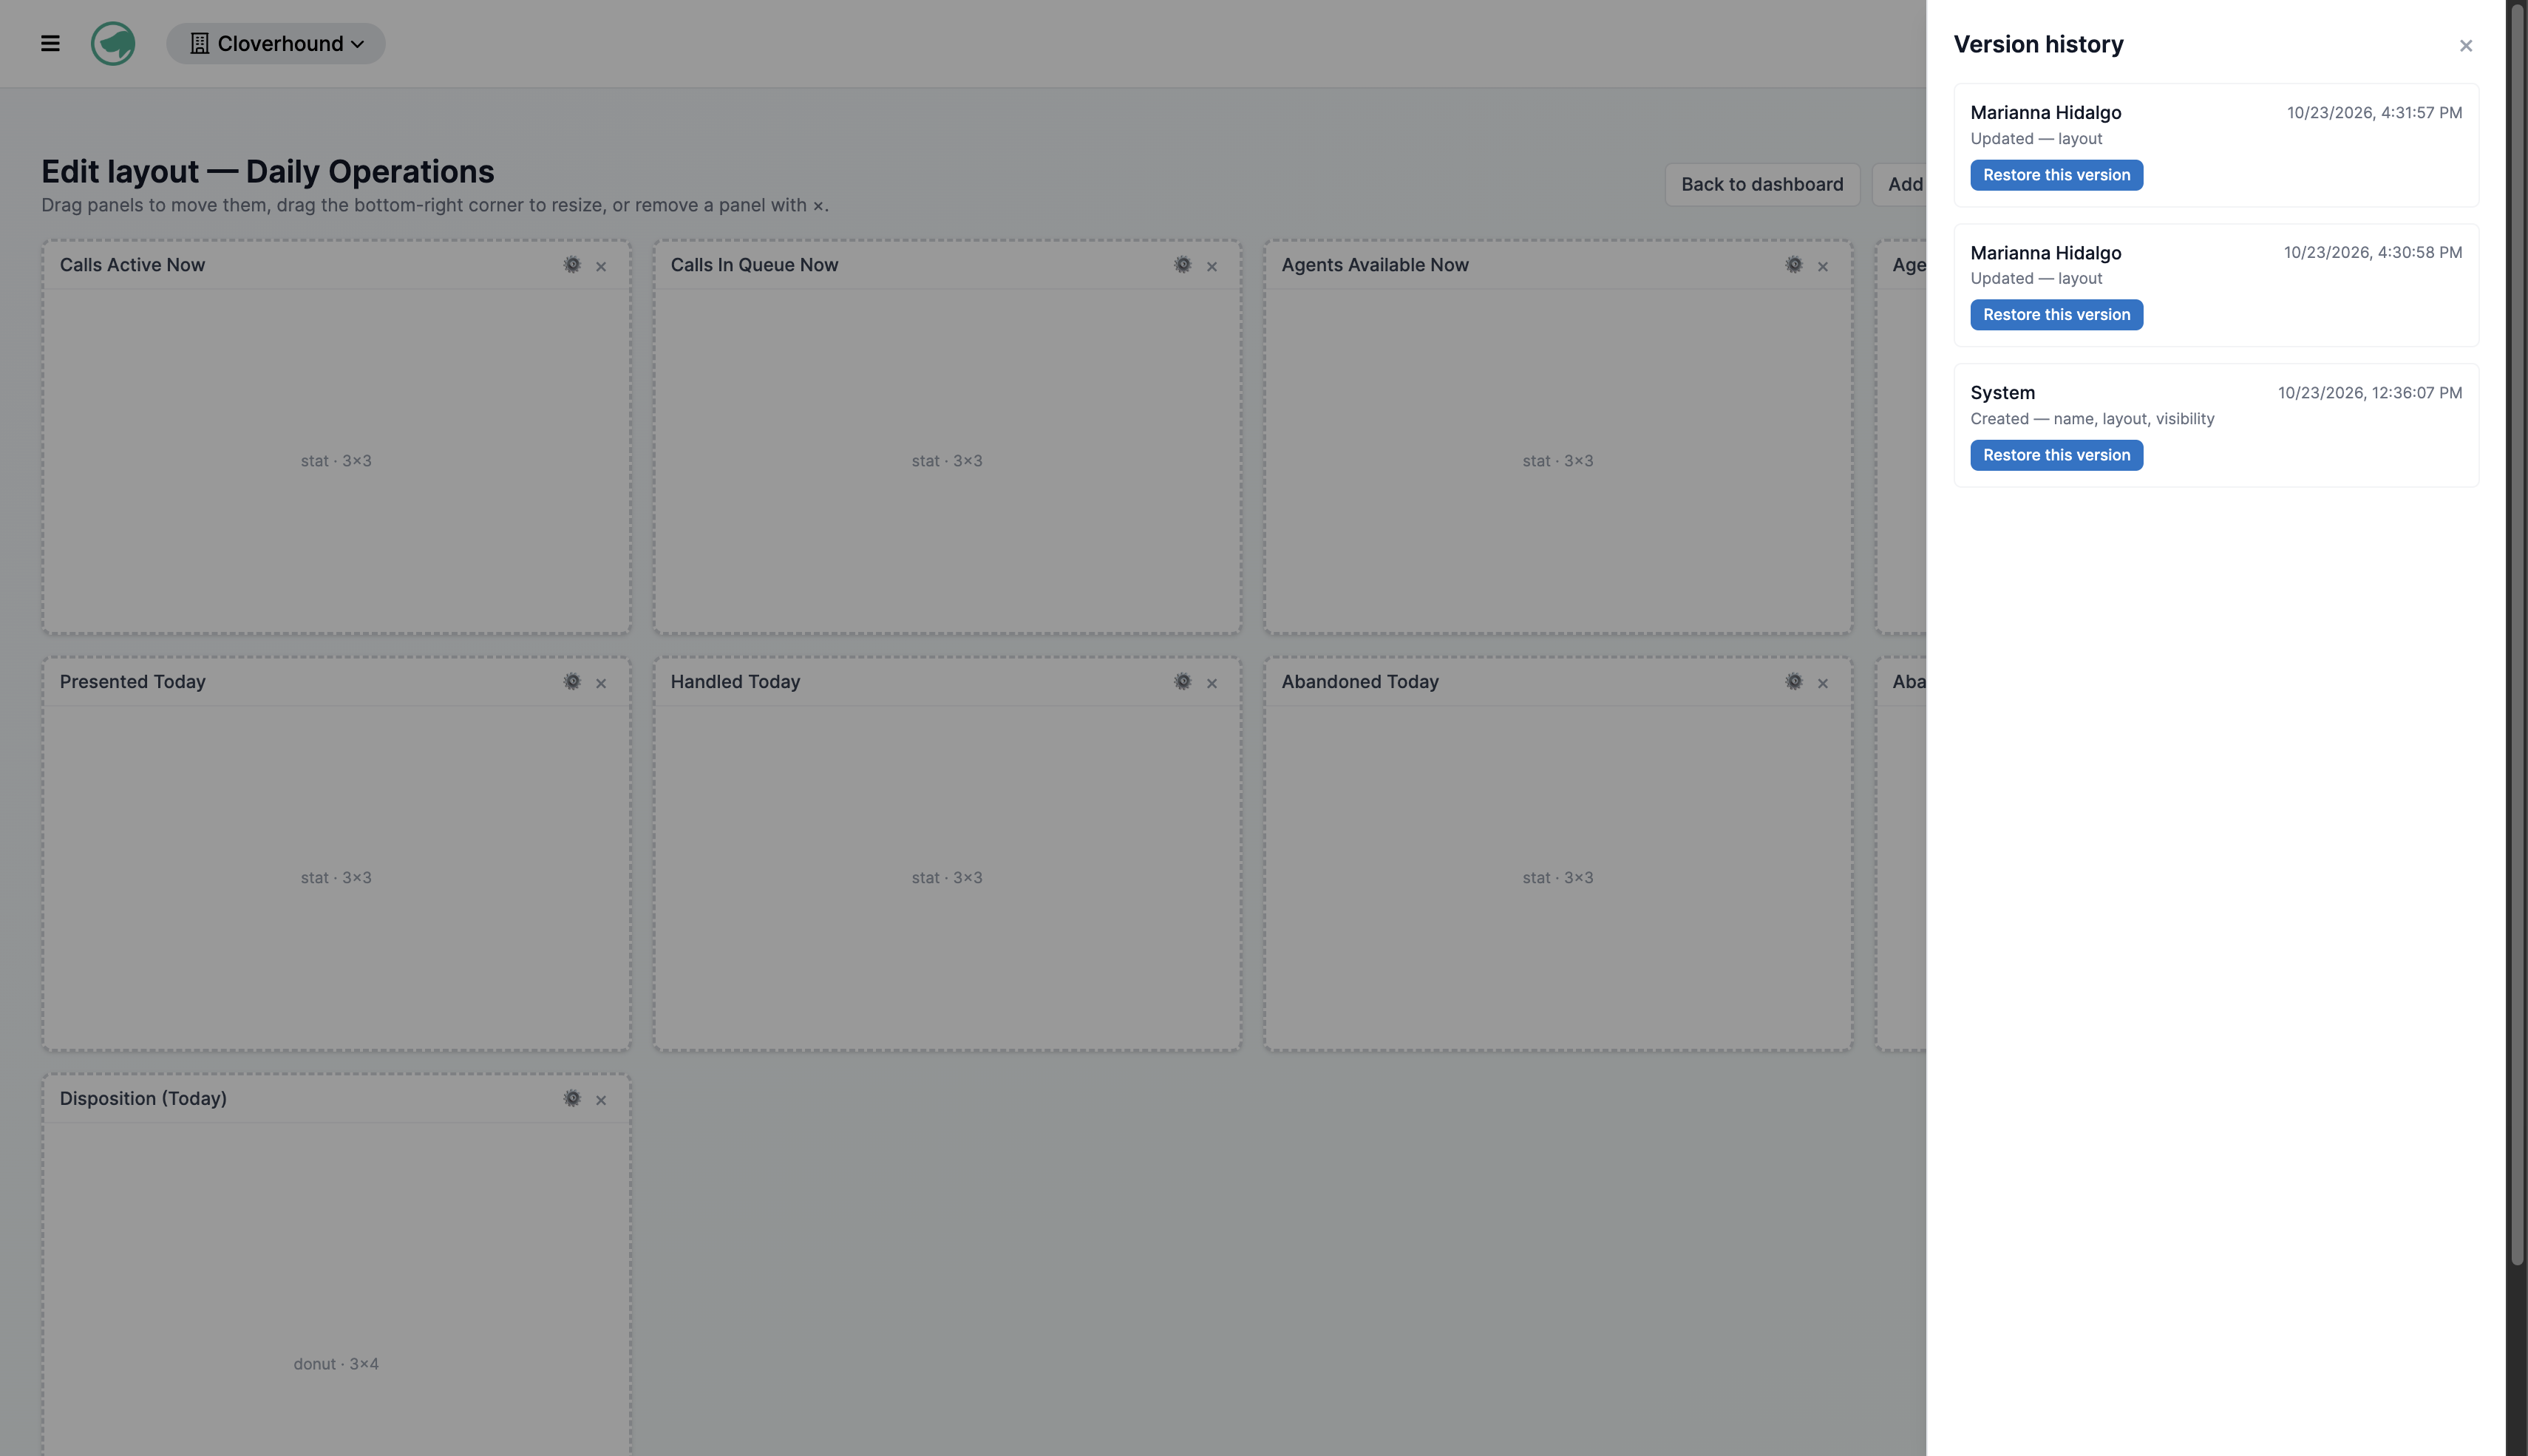
Changes to a dashboard are recorded, so you can go back to an earlier version.
-
Click History. The Version history panel lists the most recent versions, newest first, each marked Created or Updated with a short note of what changed (for example, the layout).
-
Click Restore this version on the one you want.
-
Confirm if the editor warns that you have unsaved changes that would be lost.
The page confirms with Restored a previous version.
Deleting a Dashboard
- Go to the Dashboards page.
- Click Delete on the dashboard's card.
- Click Confirm, or Cancel to keep it.
Only dashboards that are not templates can be deleted, and only by an administrator or the person who created them.