Dashboards Module
The Dashboards module lets you build and share live views of your contact center: large number tiles, charts, tables, and boards that refresh on their own. Use it to keep an eye on today's interaction volume, abandoned calls, agent availability, queue health, and call flow tests, on your own screen or on a wall-mounted display.
What's in This Module
- Dashboards: ready-made templates you can clone, and your own dashboards built from panels. Each dashboard is a grid of panels that you arrange and resize.
- Sharing: choose who can see each dashboard, from only you to everyone in your organization, or specific people and roles.
- Kiosk Tokens and Kiosk Playlists: public links for unattended screens, such as a TV in a contact center. Available to organization administrators.
Detailed guides for each area are available in the sidebar.
Accessing the Dashboards Module
-
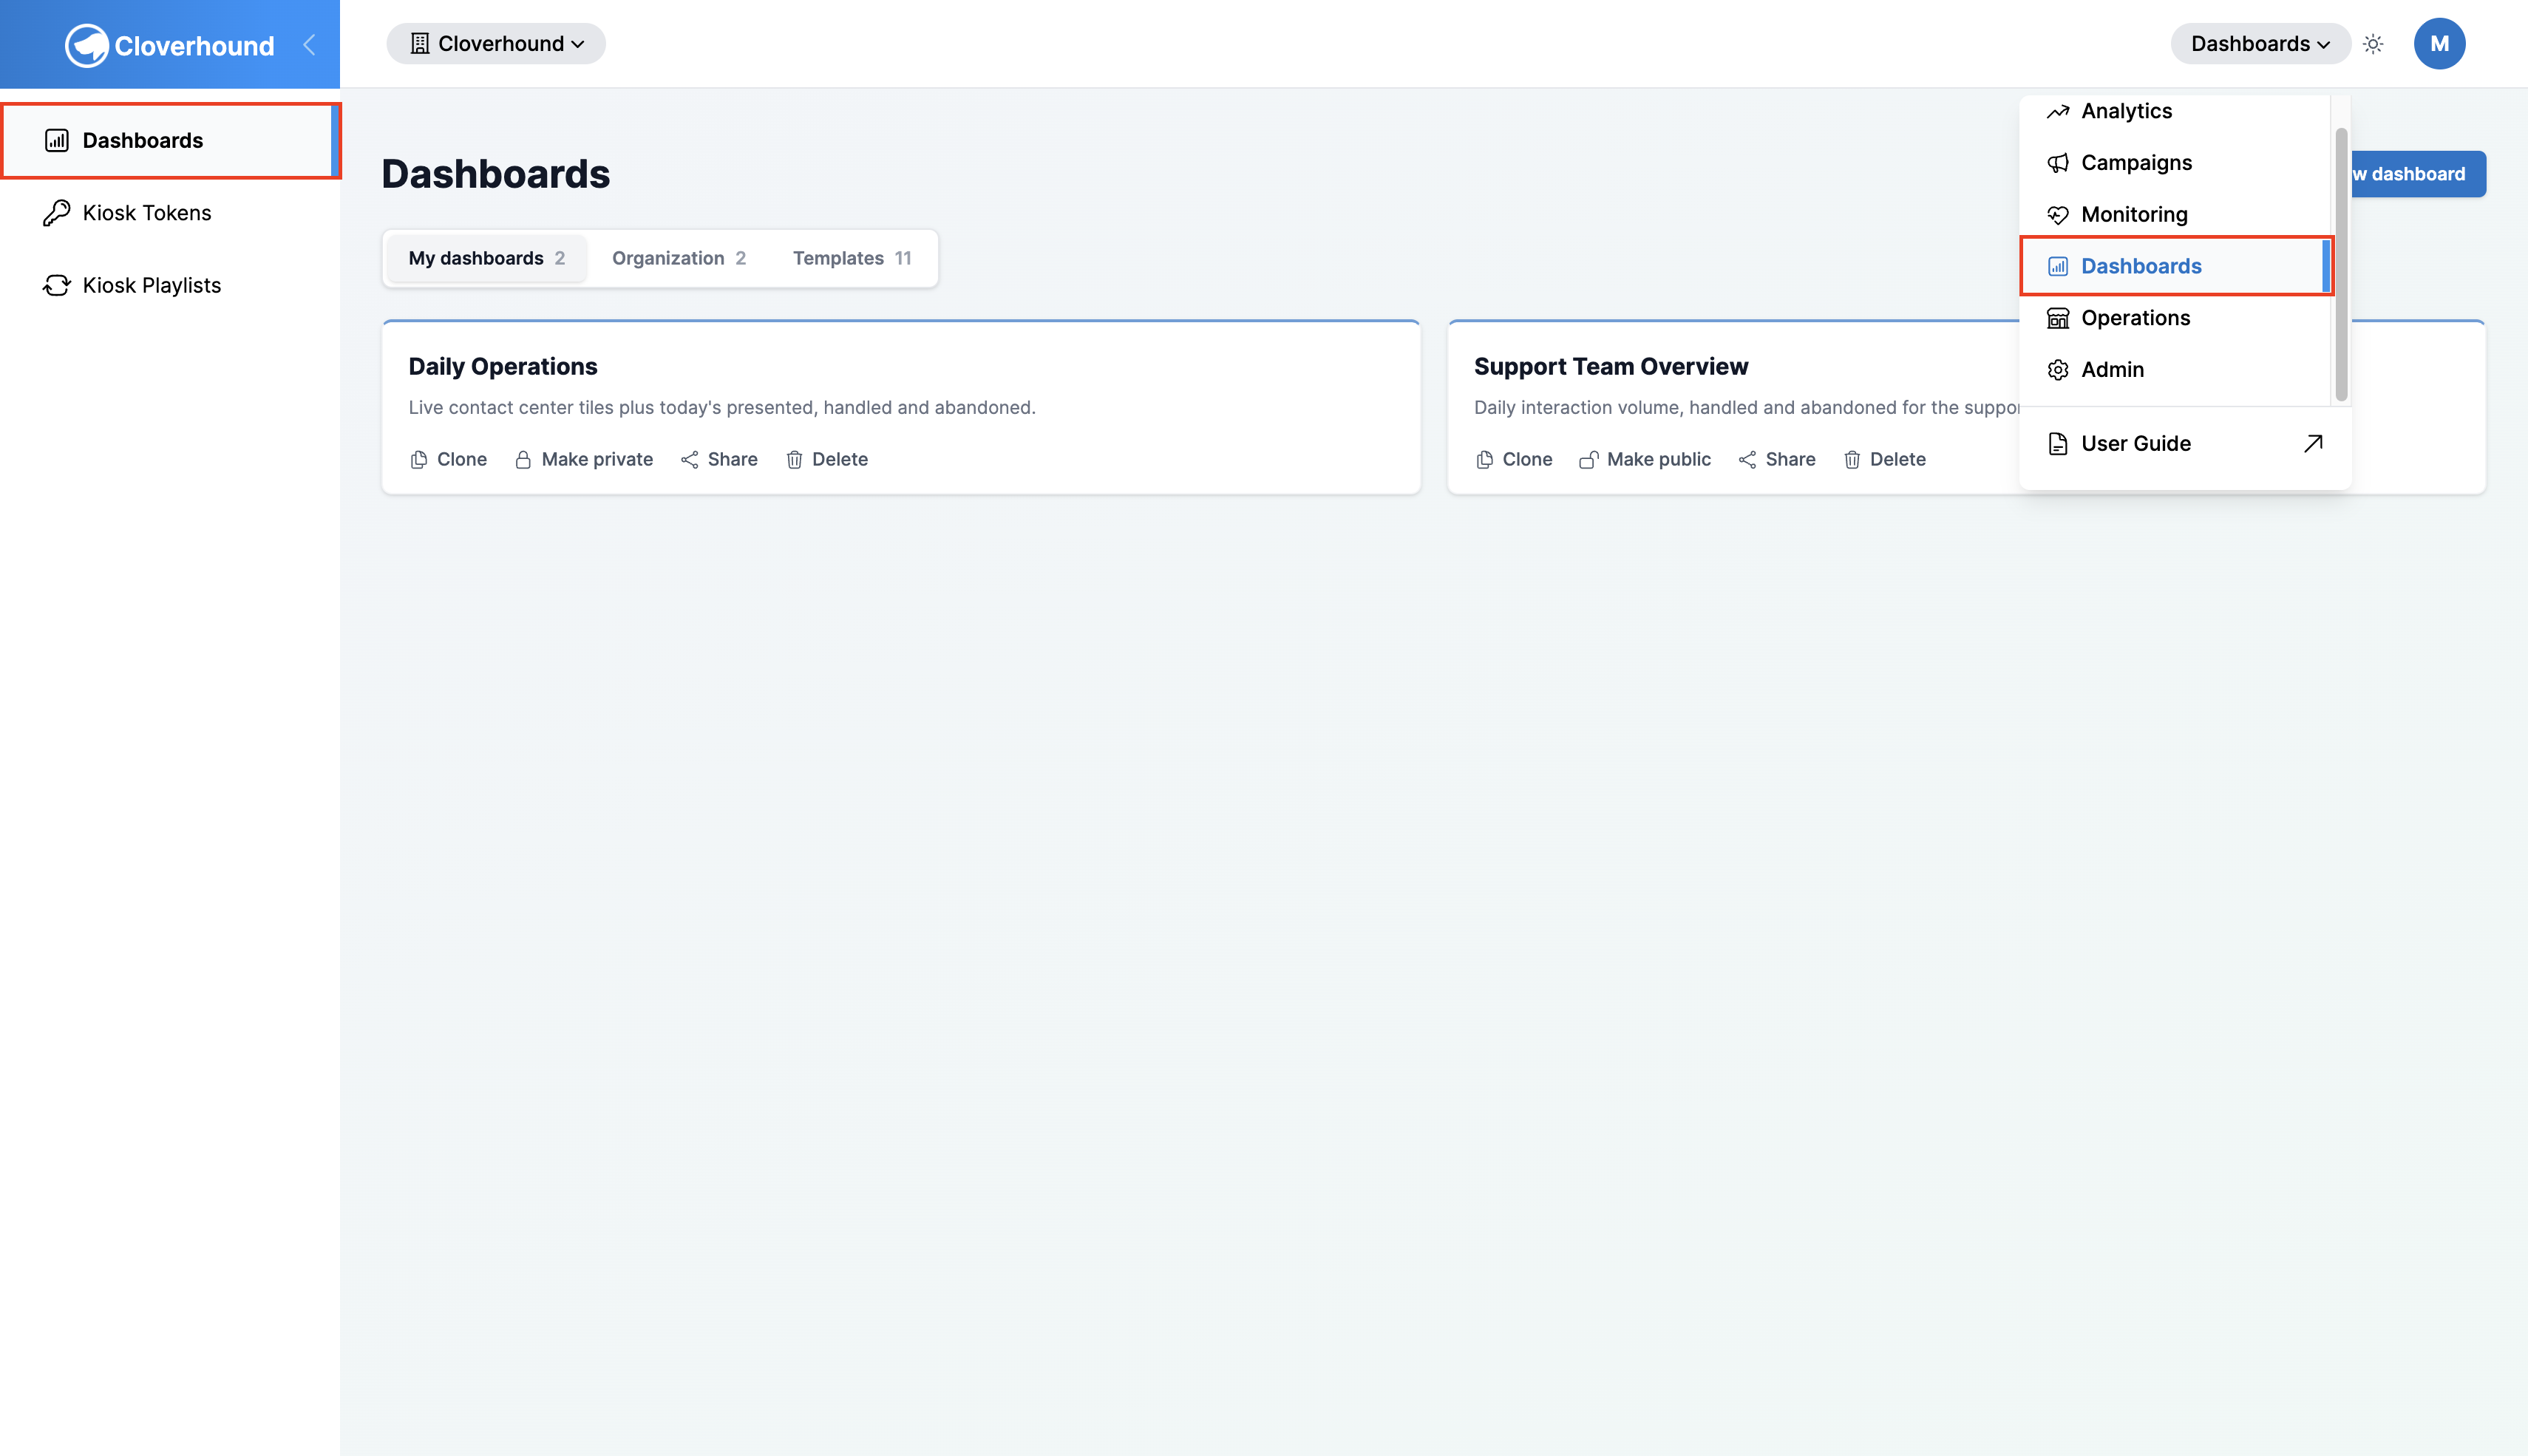
Navigate to the Dashboards module.
-
Open the Dashboards page from the module's navigation.
The Dashboards module only appears if it is enabled for your organization. If you don't see it, ask your administrator. The Kiosk Tokens and Kiosk Playlists pages are only shown to organization administrators.
The Dashboards List
The Dashboards page shows your dashboards as cards, organized in three tabs. Each tab shows how many dashboards it contains.
- My dashboards: dashboards you created, including copies you made by cloning.
- Organization: dashboards created by other people that you are allowed to see.
- Templates: ready-made dashboards that you can clone but not change.
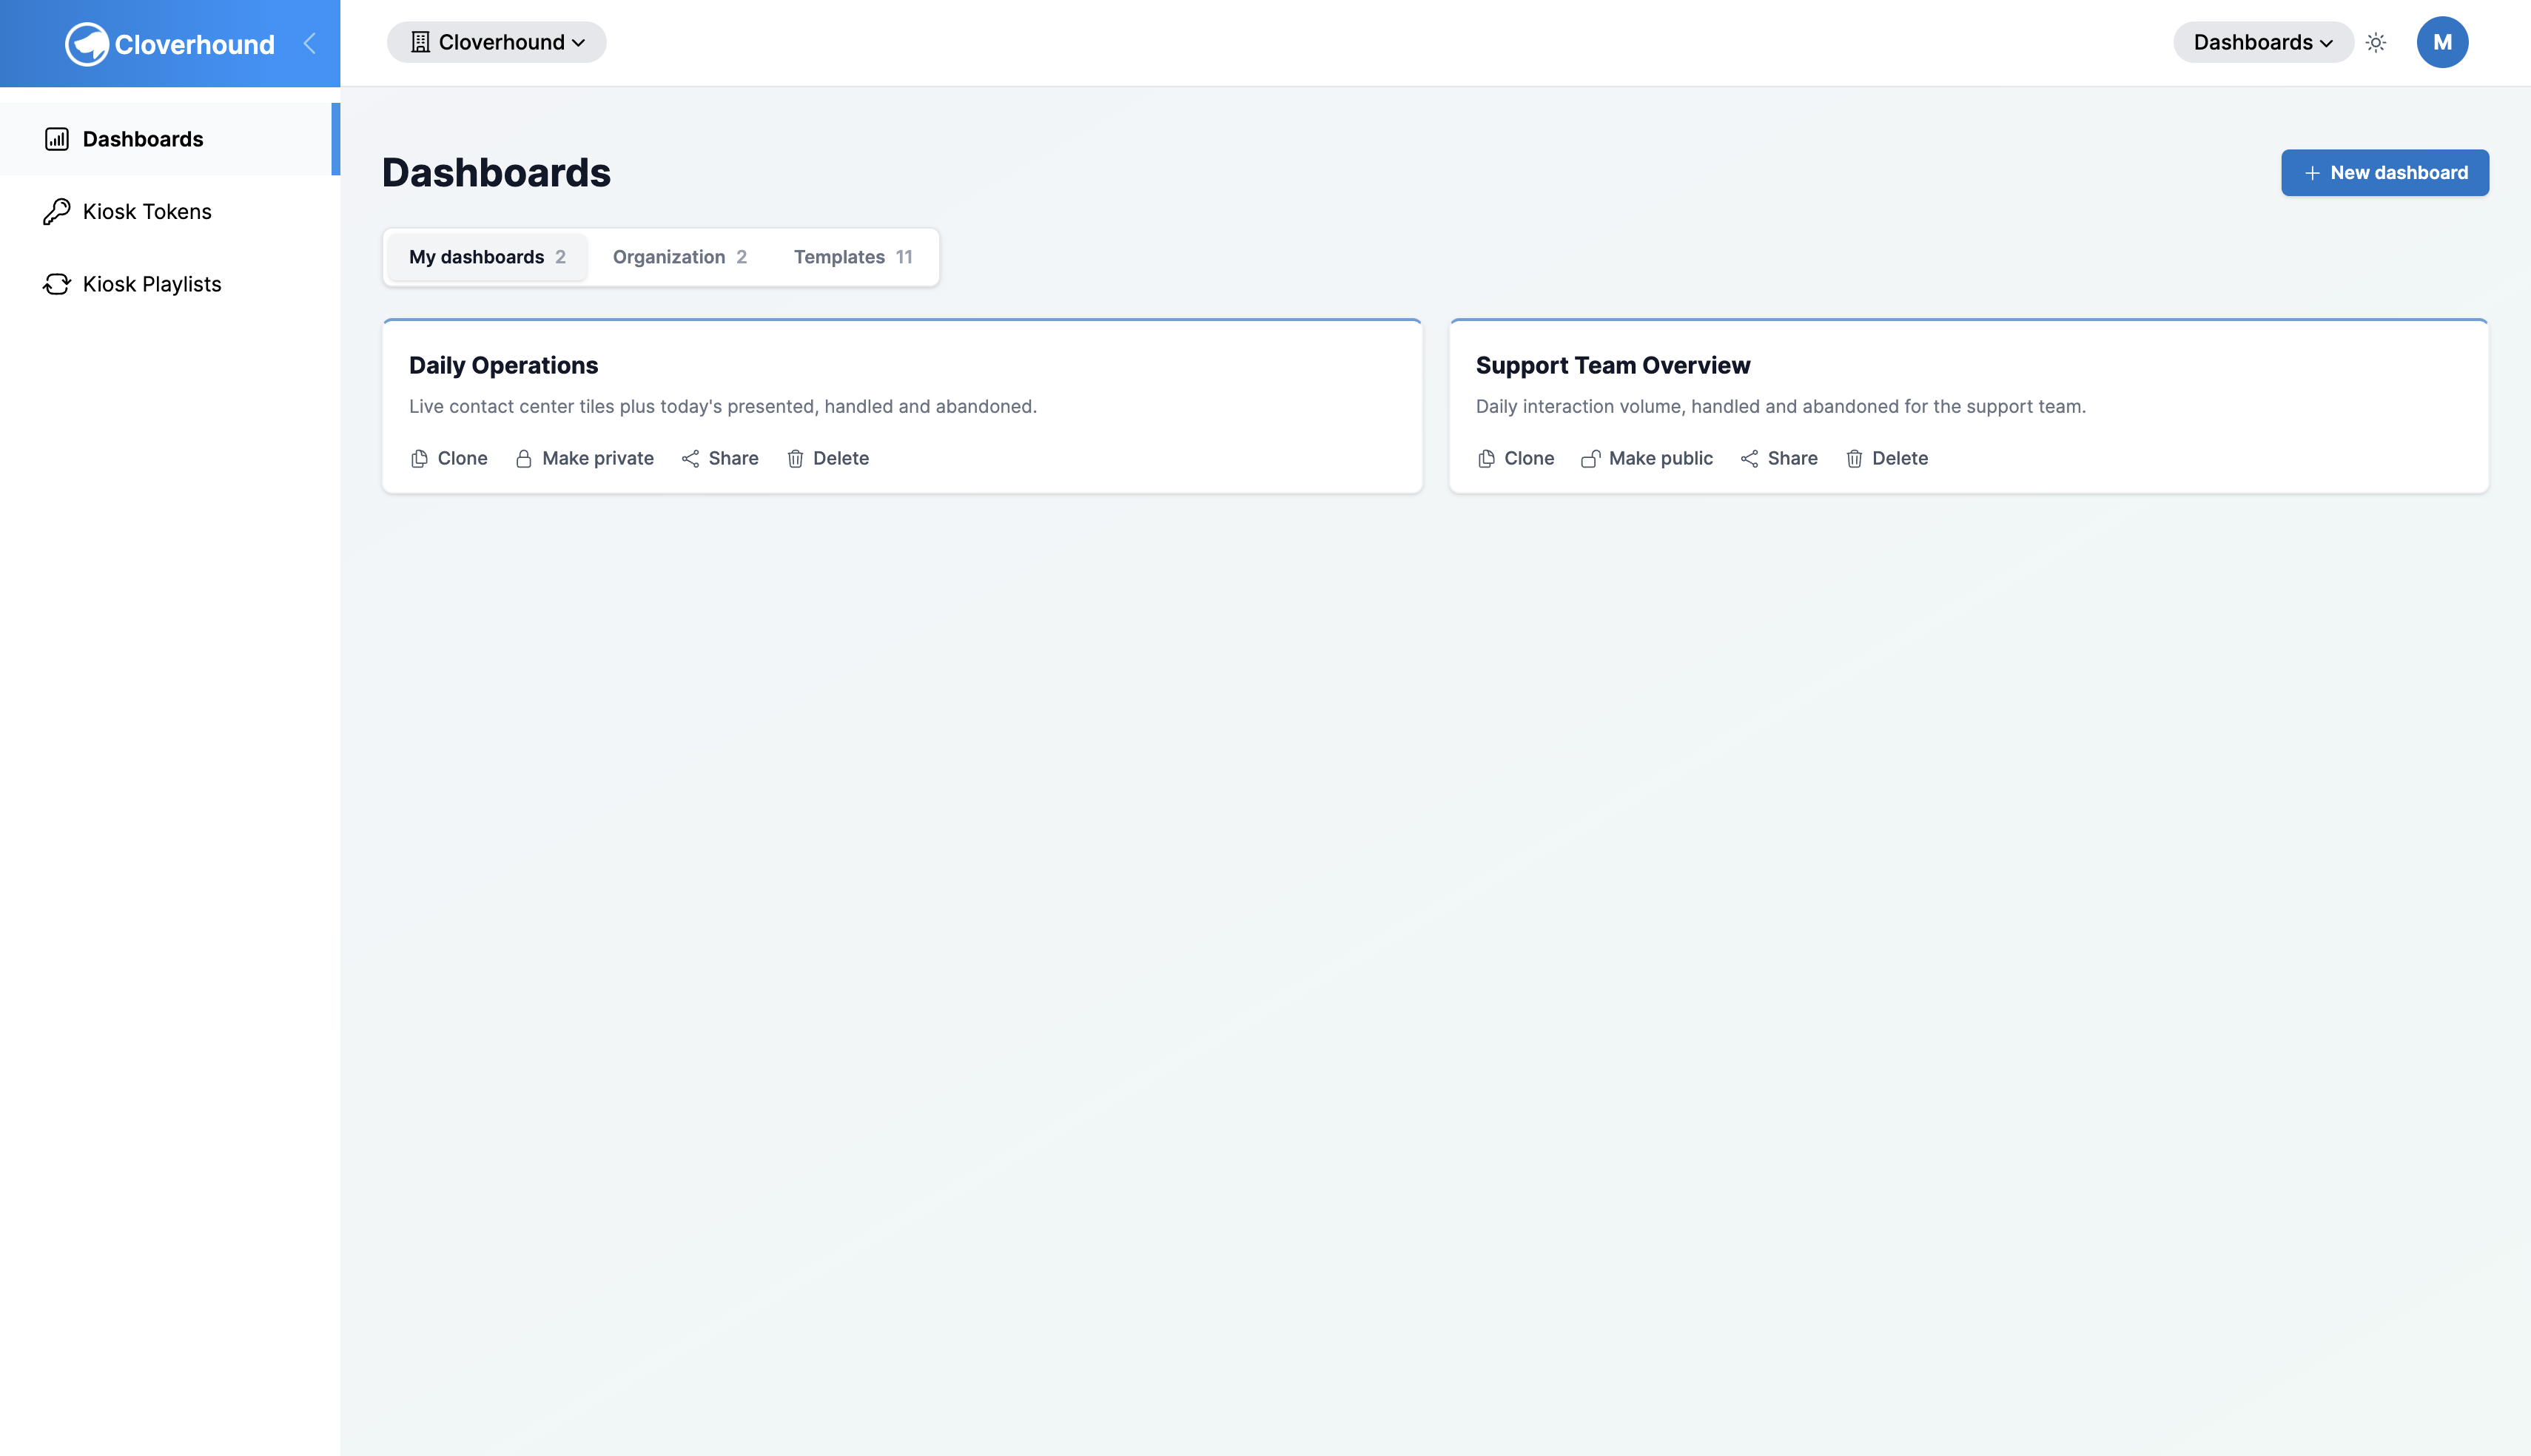
Each card shows the dashboard name, its description, and a Template badge when it is a template. The actions at the bottom of the card depend on what you are allowed to do with that dashboard. For details, see Sharing Dashboards and Using Templates.
If a tab has nothing to show, it displays No dashboards here yet.
Viewing a Dashboard
-
Click the name of a dashboard on its card.
-
Read the panels. Each one shows its own title and a live value, chart, or table.
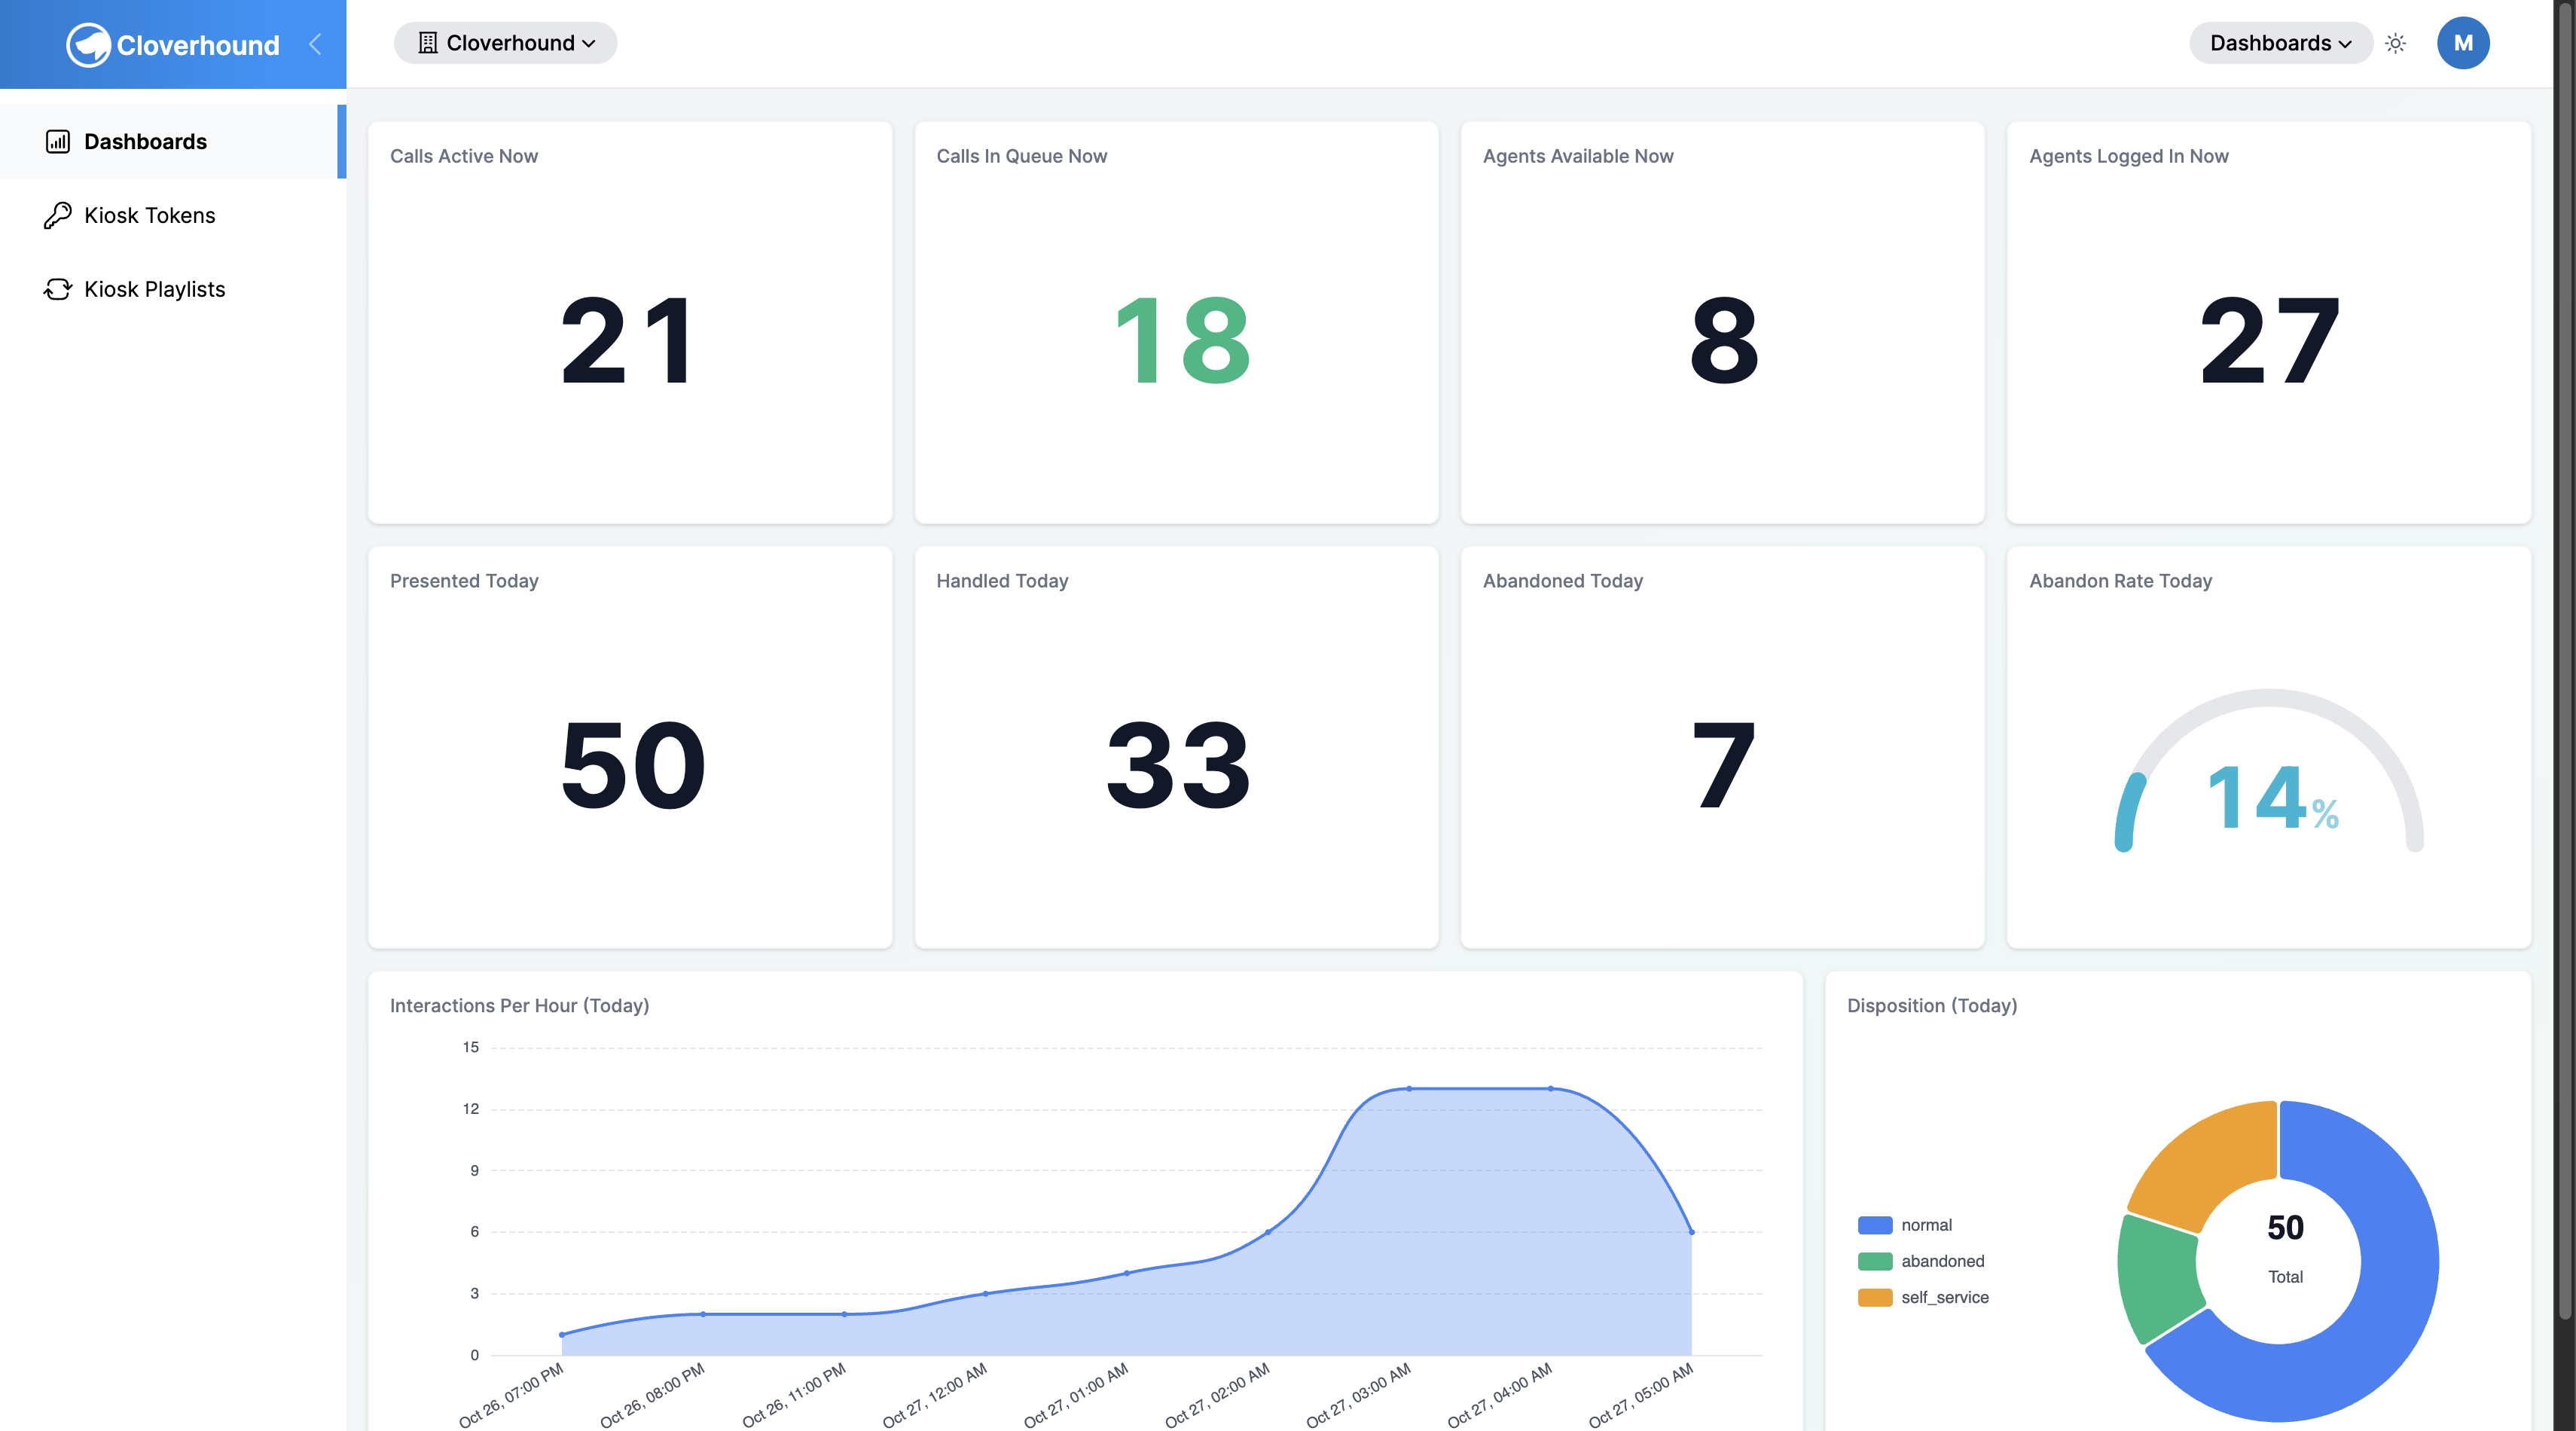
The dashboard refreshes by itself, so you do not need to reload the page. It refreshes about once a minute, and about every 15 seconds when it contains live panels (calls in progress, agents, or queues). If a refresh fails, the panel keeps showing its last good values and displays a small badge that reads stale next to it.
Dates and times use your organization's time zone. A panel that covers today runs from midnight to midnight in that time zone.
If you can edit the dashboard, an Edit layout button appears above the panels. Templates cannot be edited, so they do not show it.
Opening the Records Behind a Number
Many Stat panels are links. Hover over the number: if it is underlined, click it to open the list of records it counted, already filtered. For example, Abandoned Today opens Interactions filtered to the abandoned interactions of today. Ctrl-click or Cmd-click opens the list in a new tab.
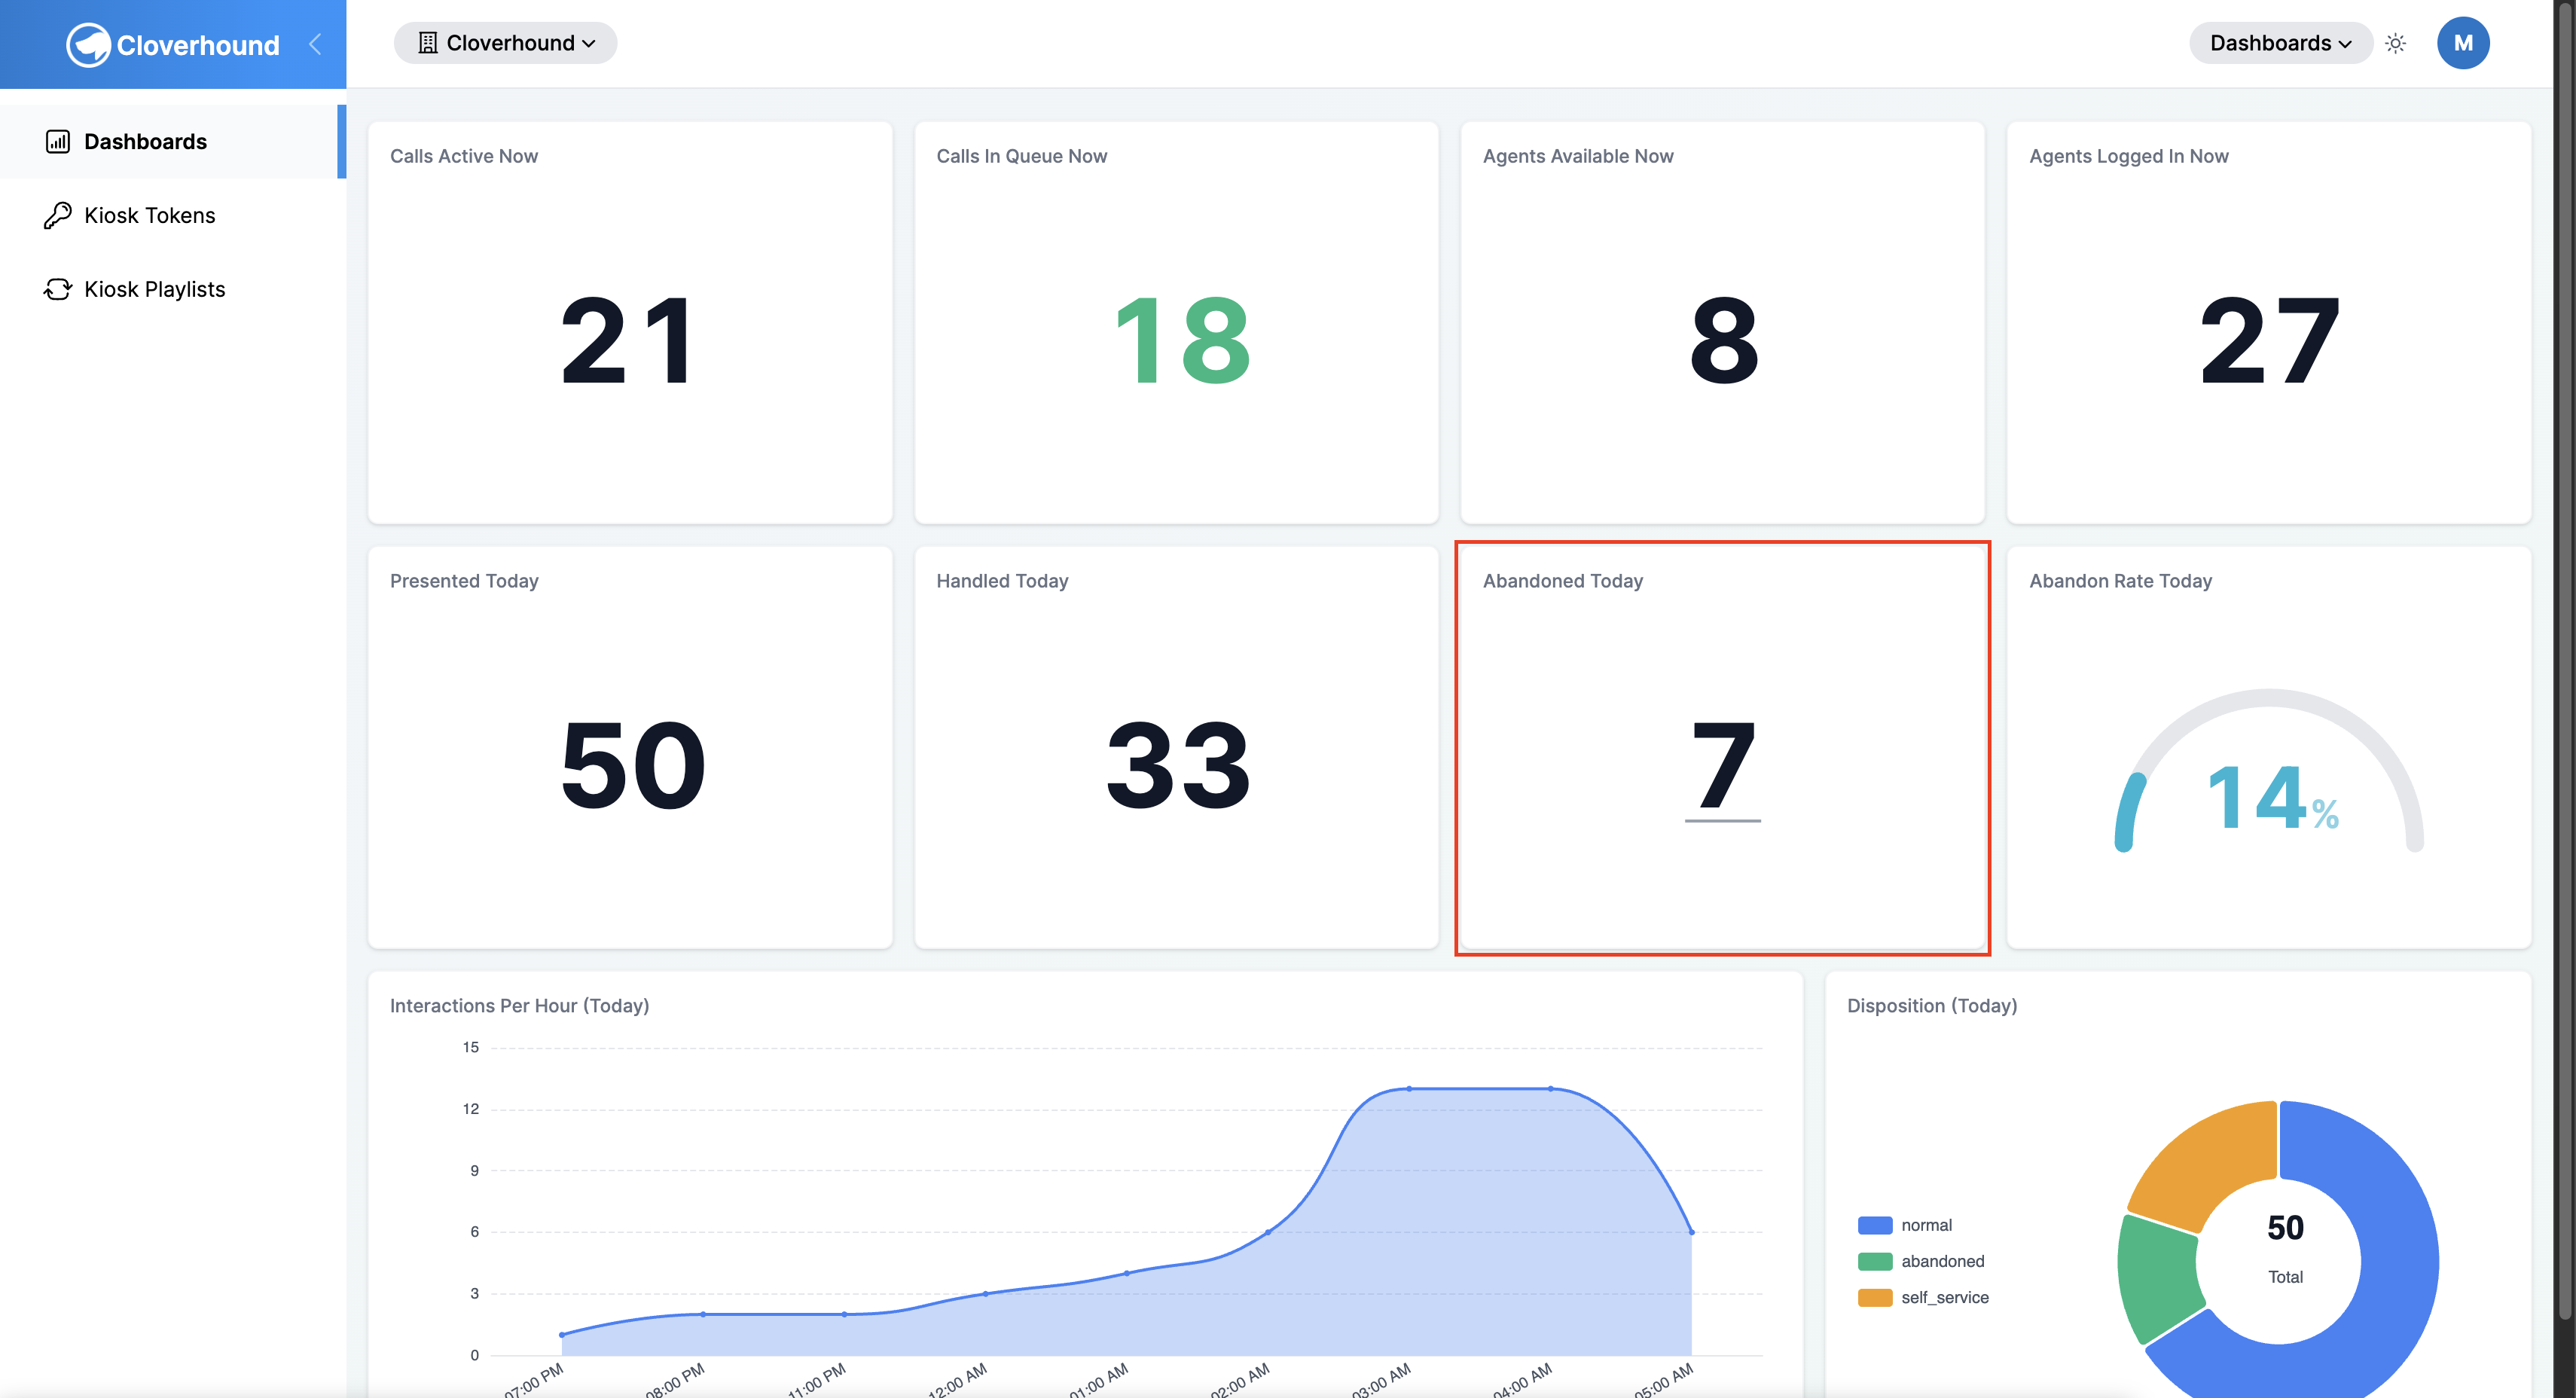
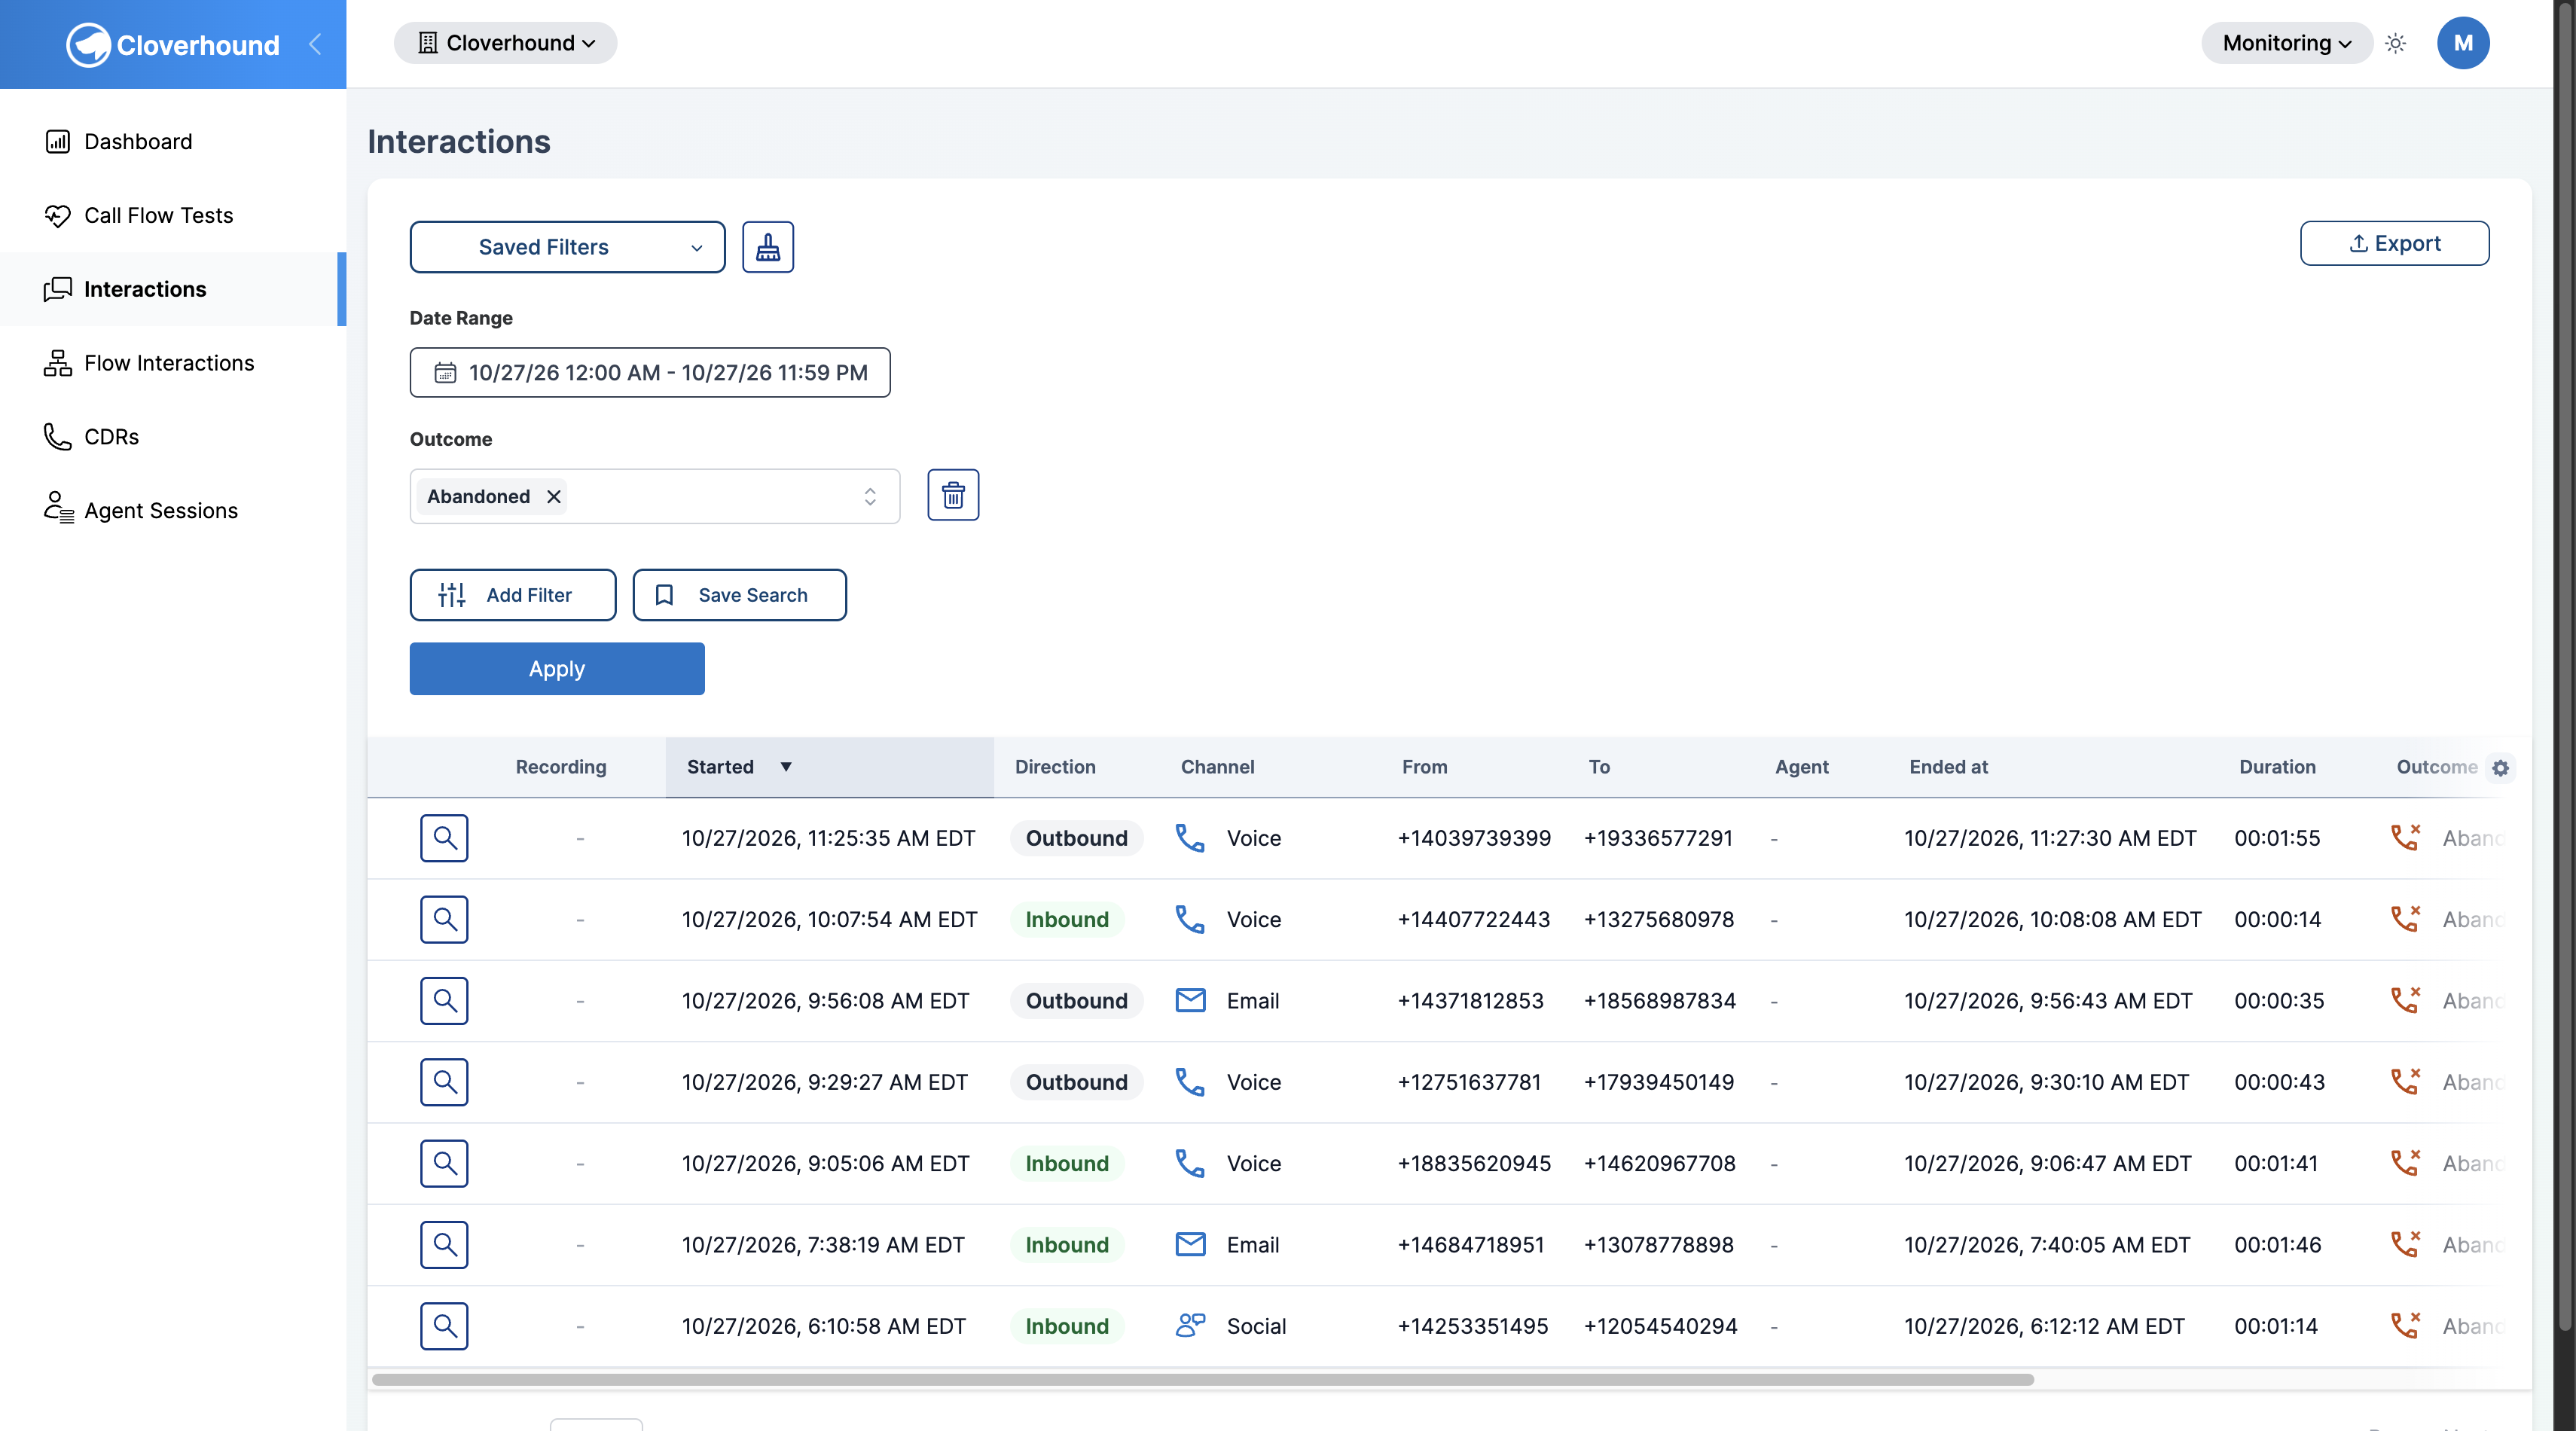
- Which panels: stat panels that count interactions, flow interactions, or agent sessions. Live numbers, averages and totals of time, call flow tests, and panels that break the number down by a category or by time are plain numbers. No underline means no link. For a percentage, the list shows the records that were counted, such as the abandoned interactions behind an abandon rate.
- Time range: the link uses the panel's own range, counted from the moment the number was calculated.
- Access: the number is a link only if you can open the page it leads to. Interactions and Flow Interactions need access to those pages, and Agent Sessions is for administrators only. If you cannot open the page, the number is not underlined.
- Wallboards: kiosk displays never show these links.
Panel Types
A dashboard is made of panels. Each panel has a type that decides how it presents its data.
| Panel type | What it shows |
|---|---|
| Stat | One large number, for example Abandoned Today. It can change color when a value crosses a threshold. Many stat panels are also links to the records behind the number. See Opening the Records Behind a Number. |
| Gauge | A single value drawn as an arc, usually a percentage such as an abandon rate, with colored zones. |
| Time series | A line, area, or bar chart over time. It can overlay the previous day or week for comparison. |
| Donut | How a total splits across categories, for example interactions by result. |
| Table | Rows and columns, such as volume by channel. |
| Board | A live board of rows, for example one row per queue, with large text and colors that flag values past a threshold. Built for wall displays. |
| Agent grid | Live cards for each agent, grouped by state (Ready, Engaged, Wrap Up, Not Ready, Not Responding, or Other), with a timer for how long the agent has been in that state and the idle code when one applies. |
Time Ranges
Every panel that shows historical data covers a time range, but the screen does not display it, so it helps to know where it comes from.
- A panel you add yourself covers the last 24 hours.
- A panel that comes from a template covers whatever range the template defines, such as today or the last 7 days. Template panel titles usually say it, for example Presented Today.
- A dashboard you create by cloning a template keeps the template's ranges.
- Live panels, such as calls in progress or agent states, show current values and do not have a time range.
You cannot change a panel's time range from the screen.
Who Can Do What
| Organization administrators | Other members | |
|---|---|---|
| View dashboards shared with Everyone | Yes | Yes |
| View a Personal dashboard created by someone else | Yes | No |
| View a Restricted dashboard | Yes | Only if granted access |
| View and clone templates | Yes | Yes |
| Create a new dashboard from scratch | Yes | No (clone an existing one instead) |
| Edit, share, or delete dashboards that are not templates | Yes | Only their own copies |
| Edit or delete templates | No | No |
| Open the list behind a stat link | Yes | Only if they have access to that list page |
| Manage kiosk tokens and playlists | Yes | No |
A member who clones a dashboard becomes the owner of the copy, so they can edit, share, and delete it.