Campaigns Dashboard
The Campaigns Dashboard is the landing page of the Campaigns module. It summarizes the state of your outbound campaigns and today's dialing activity, so you can check what is running and how records are progressing at a glance.
The dashboard is read-only. All figures are scoped to your organization and calculated in your organization's time zone. The page refreshes itself every 30 seconds.
The Campaigns Dashboard is visible to users whose role includes read access to the Campaigns Dashboard. If you don't see the dashboard when you open the Campaigns module, ask your administrator to grant your role the appropriate permission.
Accessing the Campaigns Dashboard
-
Navigate to the Campaigns module.
-
Open the Dashboard page from the module's navigation.
The dashboard loads automatically and shows data for the current day.
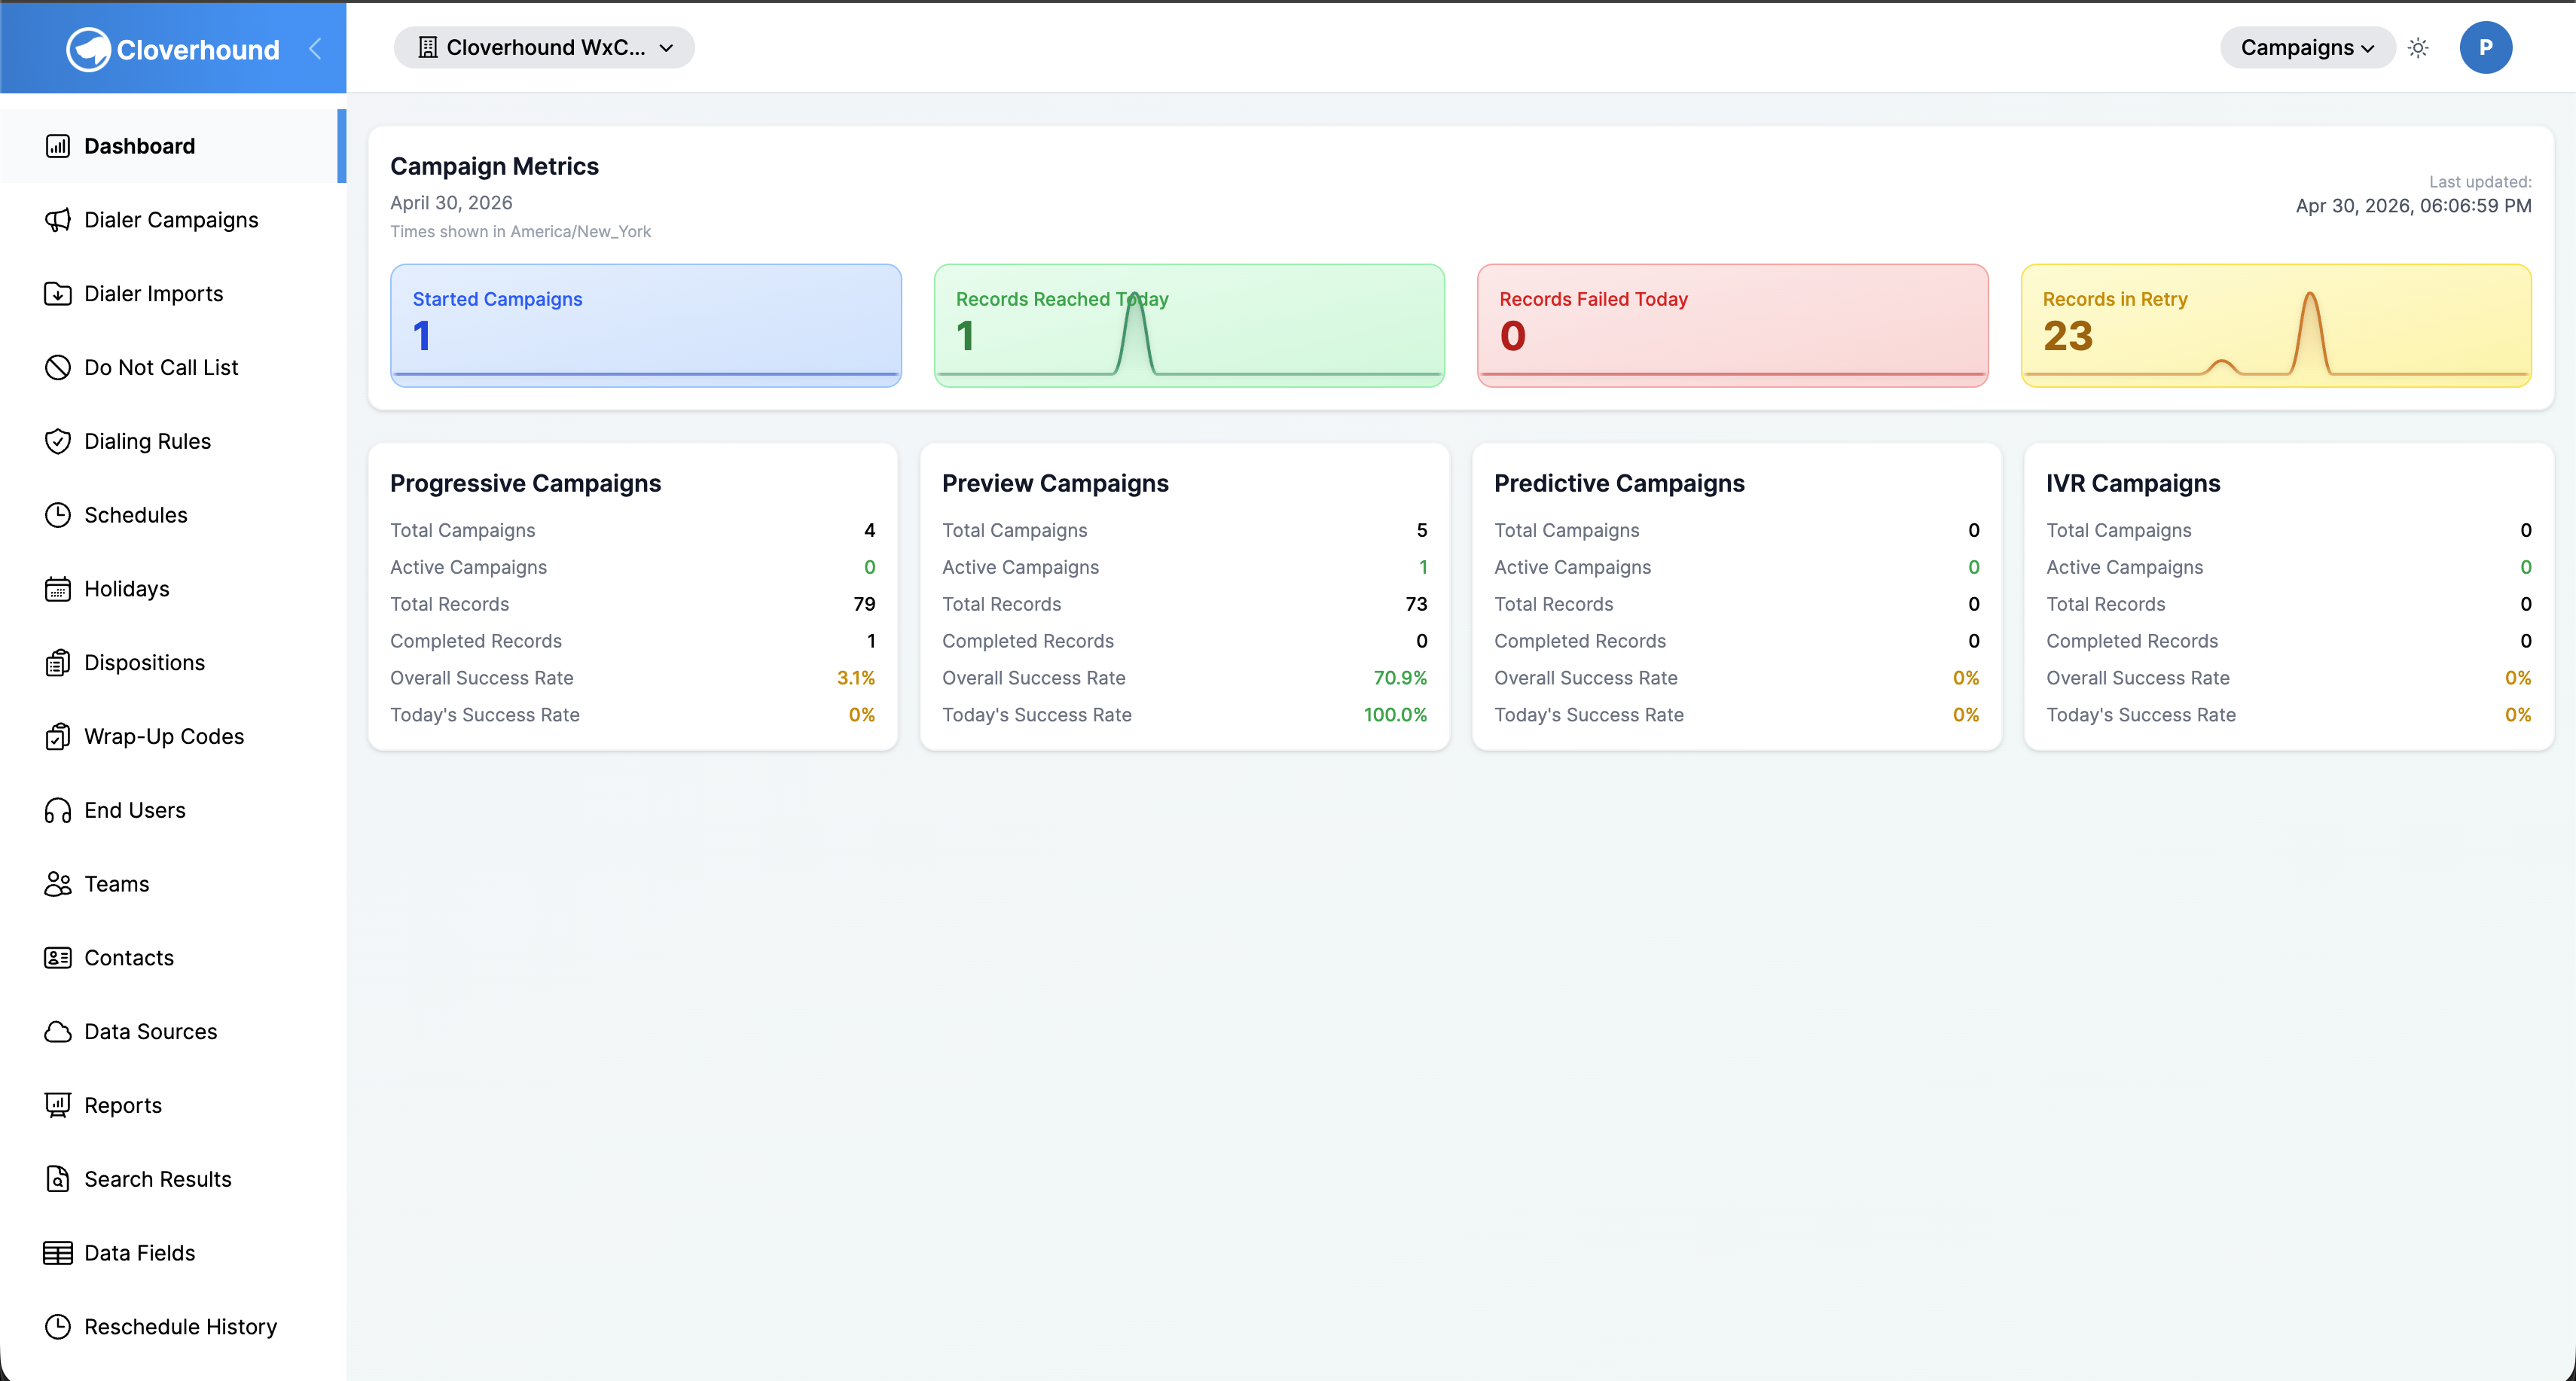
Reading Campaign Metrics
The top card on the page is labeled Campaign Metrics. Its header shows:
-
The current date in your organization's time zone.
-
A note reading Times shown in <time zone> when your organization's time zone is not UTC.
-
A Last updated timestamp on the right side of the card, showing when the metrics were last computed.

Below the header, four metric cards display today's activity. Each card shows the metric name, its total for the day so far, and a sparkline that plots the hourly breakdown across the day.
-
Started Campaigns — the number of campaigns in your organization whose status is running or idle and that are enabled. This count is not filtered to today; it reflects the current state.
-
Records Reached Today — the count of dialer results recorded today whose result is live voice.
-
Records Failed Today — the count of records whose status changed to failed today.
-
Records in Retry — the count of records currently in retry status that are eligible to be dialed by end of day.

Reading the Sparklines
Each sparkline covers the 24 one-hour buckets of the current day, from the start of the day through the current hour. The vertical scale is relative to that metric's own high and low for the day, so two sparklines are not directly comparable in height. Use the number on the card to compare metrics, and use the sparkline to see when activity peaked.
The Started Campaigns sparkline plots how many campaigns were in a running or idle state at the end of each hour, so you can see whether campaign activity ramped up or down through the day.
"Today" starts at midnight in your organization's time zone, not in UTC. If your organization's time zone is set to something other than UTC, the note under the date confirms the time zone used for both the totals and the sparklines.
Reading Campaign Type Summaries
Below the Campaign Metrics card, the dashboard shows a row of summary cards, one per campaign type:
-
Progressive Campaigns
-
Preview Campaigns
-
Predictive Campaigns
-
IVR Campaigns
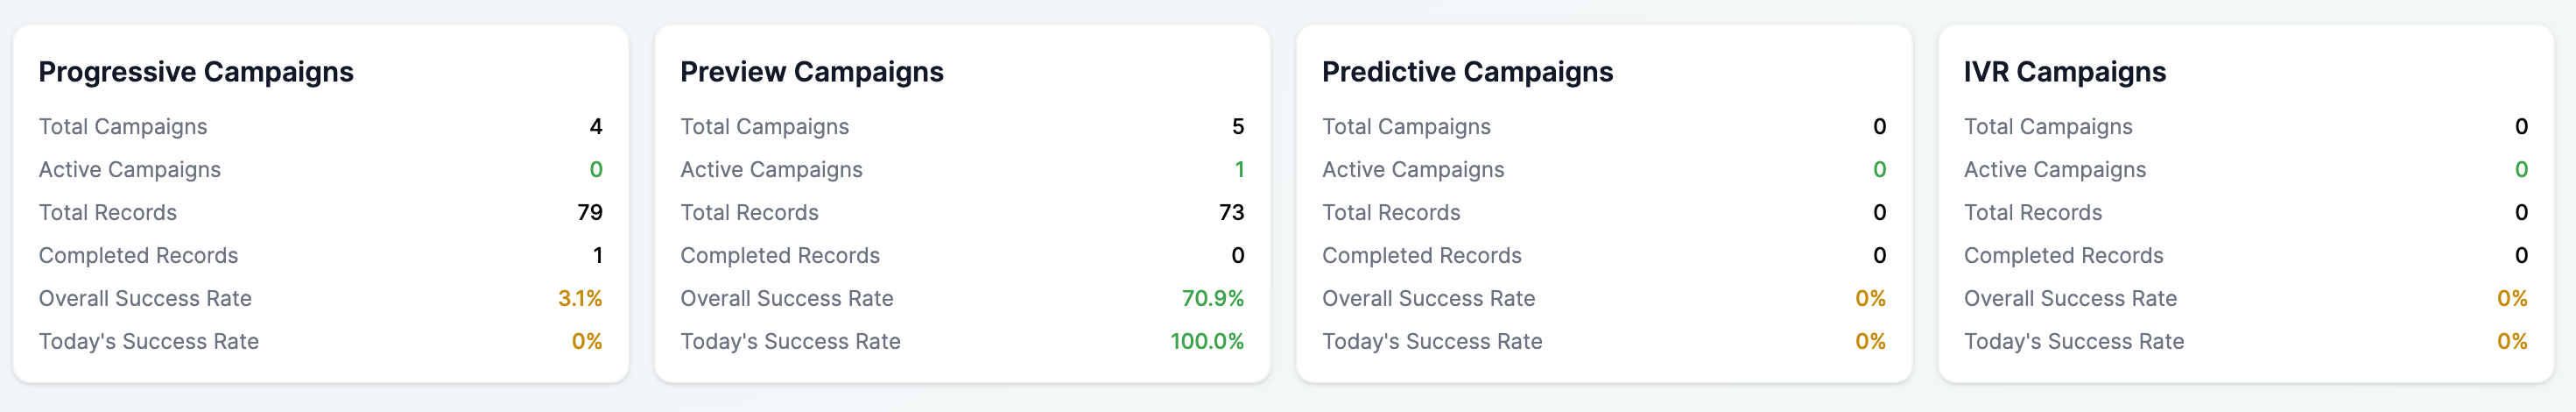
Each card lists the following for campaigns of that type in your organization:
- Total Campaigns — all campaigns of this type, regardless of status.
- Active Campaigns — campaigns whose status is running or idle.
- Total Records — the sum of records across all campaigns of this type.
- Completed Records — the sum of completed records across all campaigns of this type.
- Overall Success Rate — the percentage of all dialer attempts for this type whose result is live voice, across the full history of the campaigns.
- Today's Success Rate — the same calculation restricted to dialer attempts made today.
Success rates display in green when they are at or above 50 percent, and in yellow when they are below 50 percent. When a campaign type has no attempts in the relevant window, its success rate is shown as 0%.
Refreshing the Dashboard
The dashboard refreshes on its own every 30 seconds, pulling fresh metrics in the background. To force an immediate refresh, reload your browser.
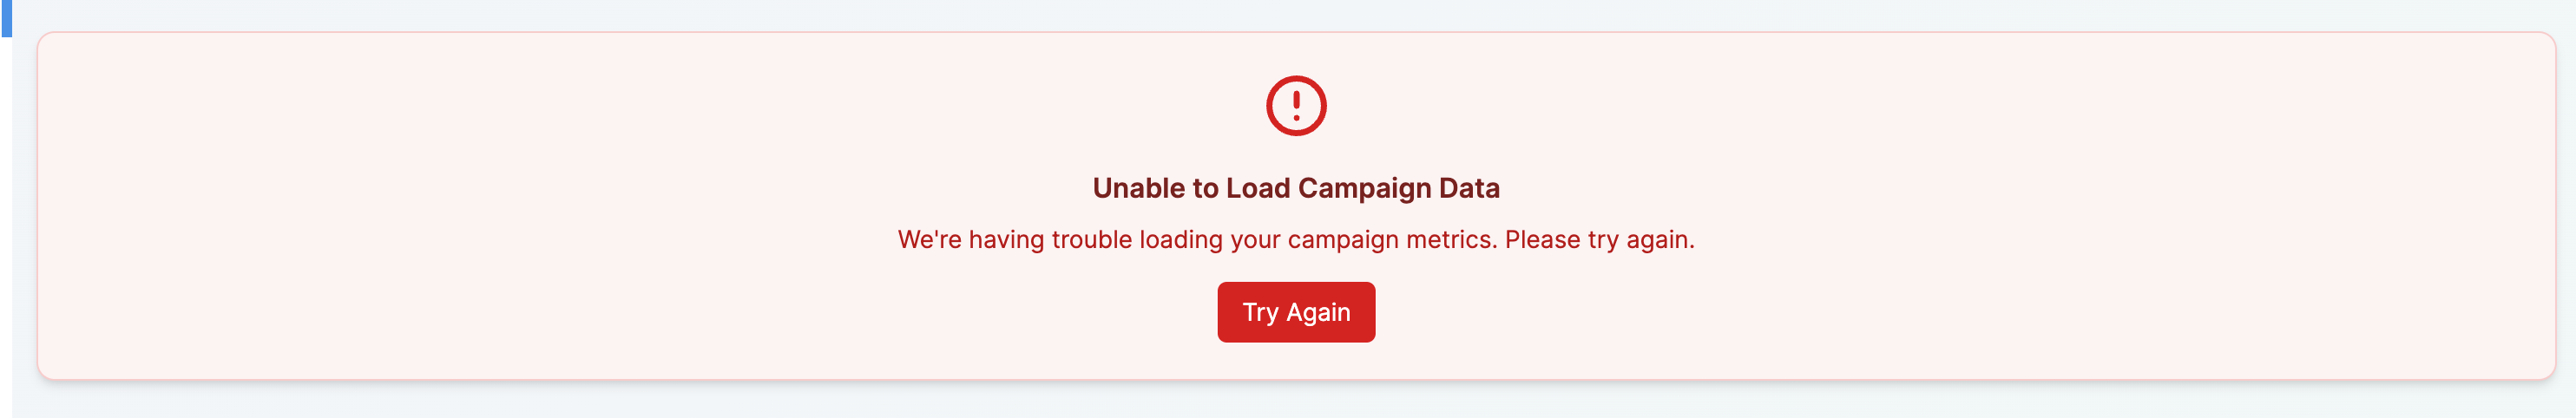
If the dashboard cannot load its data, an error card replaces the metrics with the message Unable to Load Campaign Data.
-
Click the Try Again button to re-request the data.
-
If the error persists, contact your administrator.
The error card appears when the metrics service cannot compute today's totals. Until the retry succeeds, the page shows zeros in place of the real counts.
Related Pages
- Introduction to Campaigns — overview of the campaigns list and how campaigns run.
- Campaign Types — definitions of progressive, preview, predictive, and IVR campaigns.
- Campaign Details — drill into the activity behind the totals on this page.
From the Campaigns Dashboard, you can see how many campaigns are running right now, how records are progressing today, and how each campaign type is performing both overall and today.