Viewing Call Queue Information
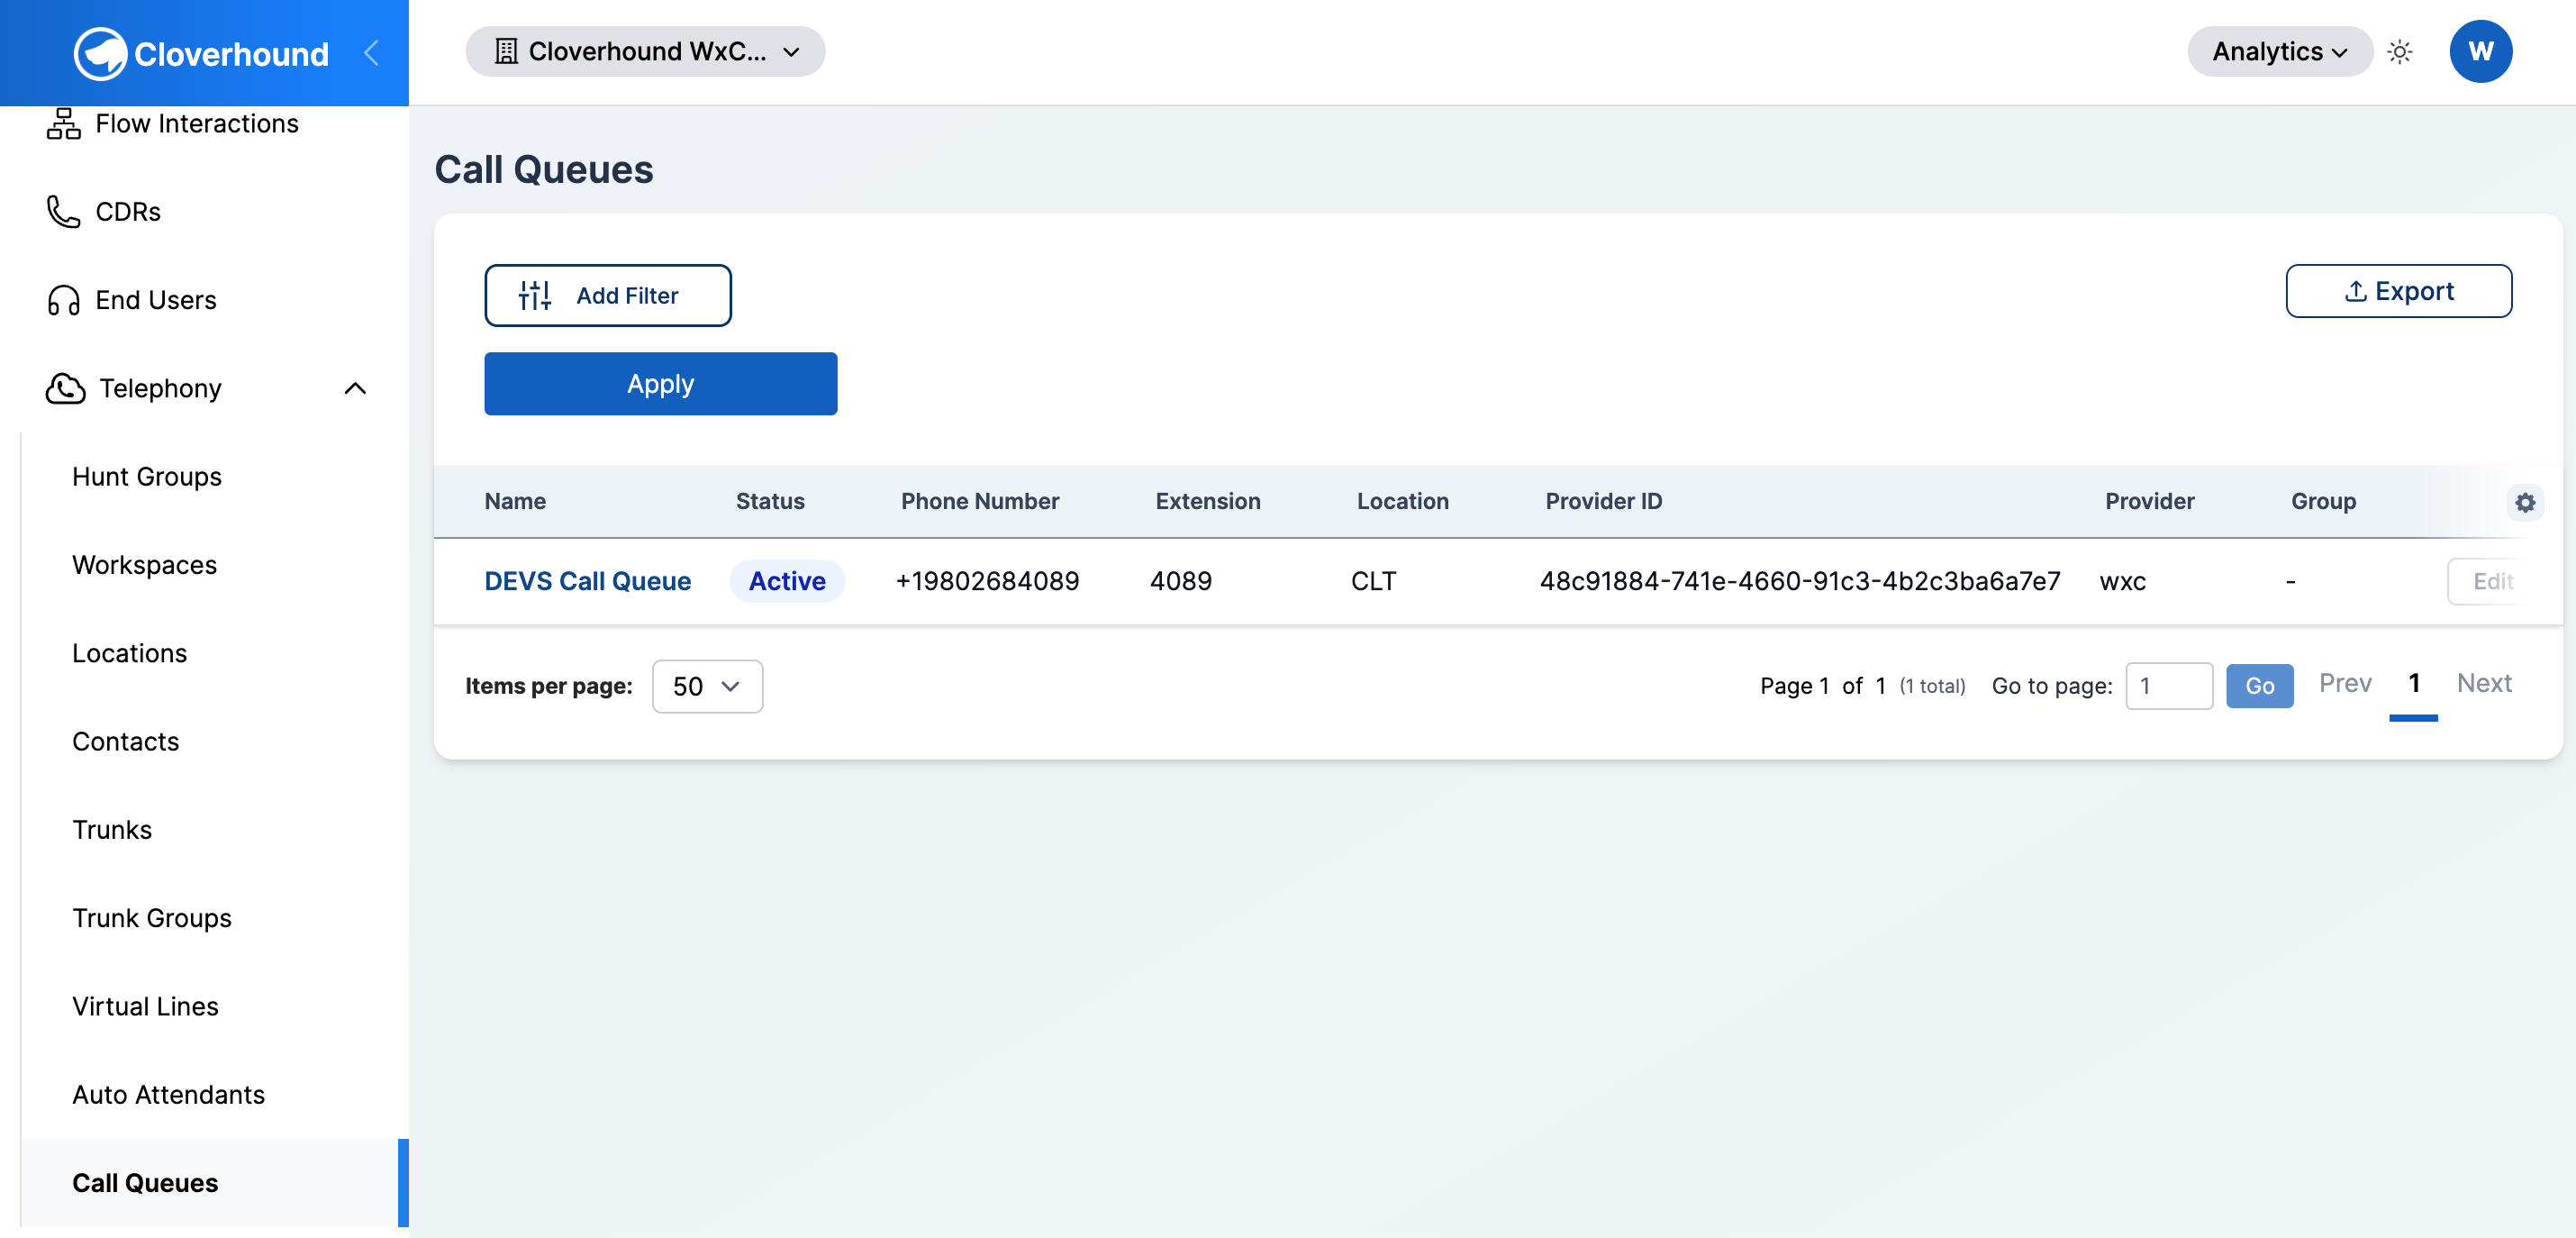
The Call Queues page lists every call queue synced to Cloverhound Cloud and lets you drill into any queue to see its activity metrics and call history.
Accessing the Call Queues Page
-
Navigate to the Call Queues Module: Select Call Queues from the main menu.
-
Review the Call Queues Table. Each row represents one call queue. Columns include:
- Name — click to open the queue's detail page.
- Status — Active or Inactive.
- Phone Number and Extension.
- Location — the Webex location the queue belongs to.
- Provider ID and Provider — the upstream identifier and source system (for example,
webex). - Group — the Cloverhound Security Group assigned to the queue.
-
Filter the table using the filter panel: Name, Phone Number, Extension, Security Group, and a Show inactive records toggle. For how filter conditions and comboboxes work, see Configuring a Filter.
-
Export the filtered list with the Export dropdown above the table.
-
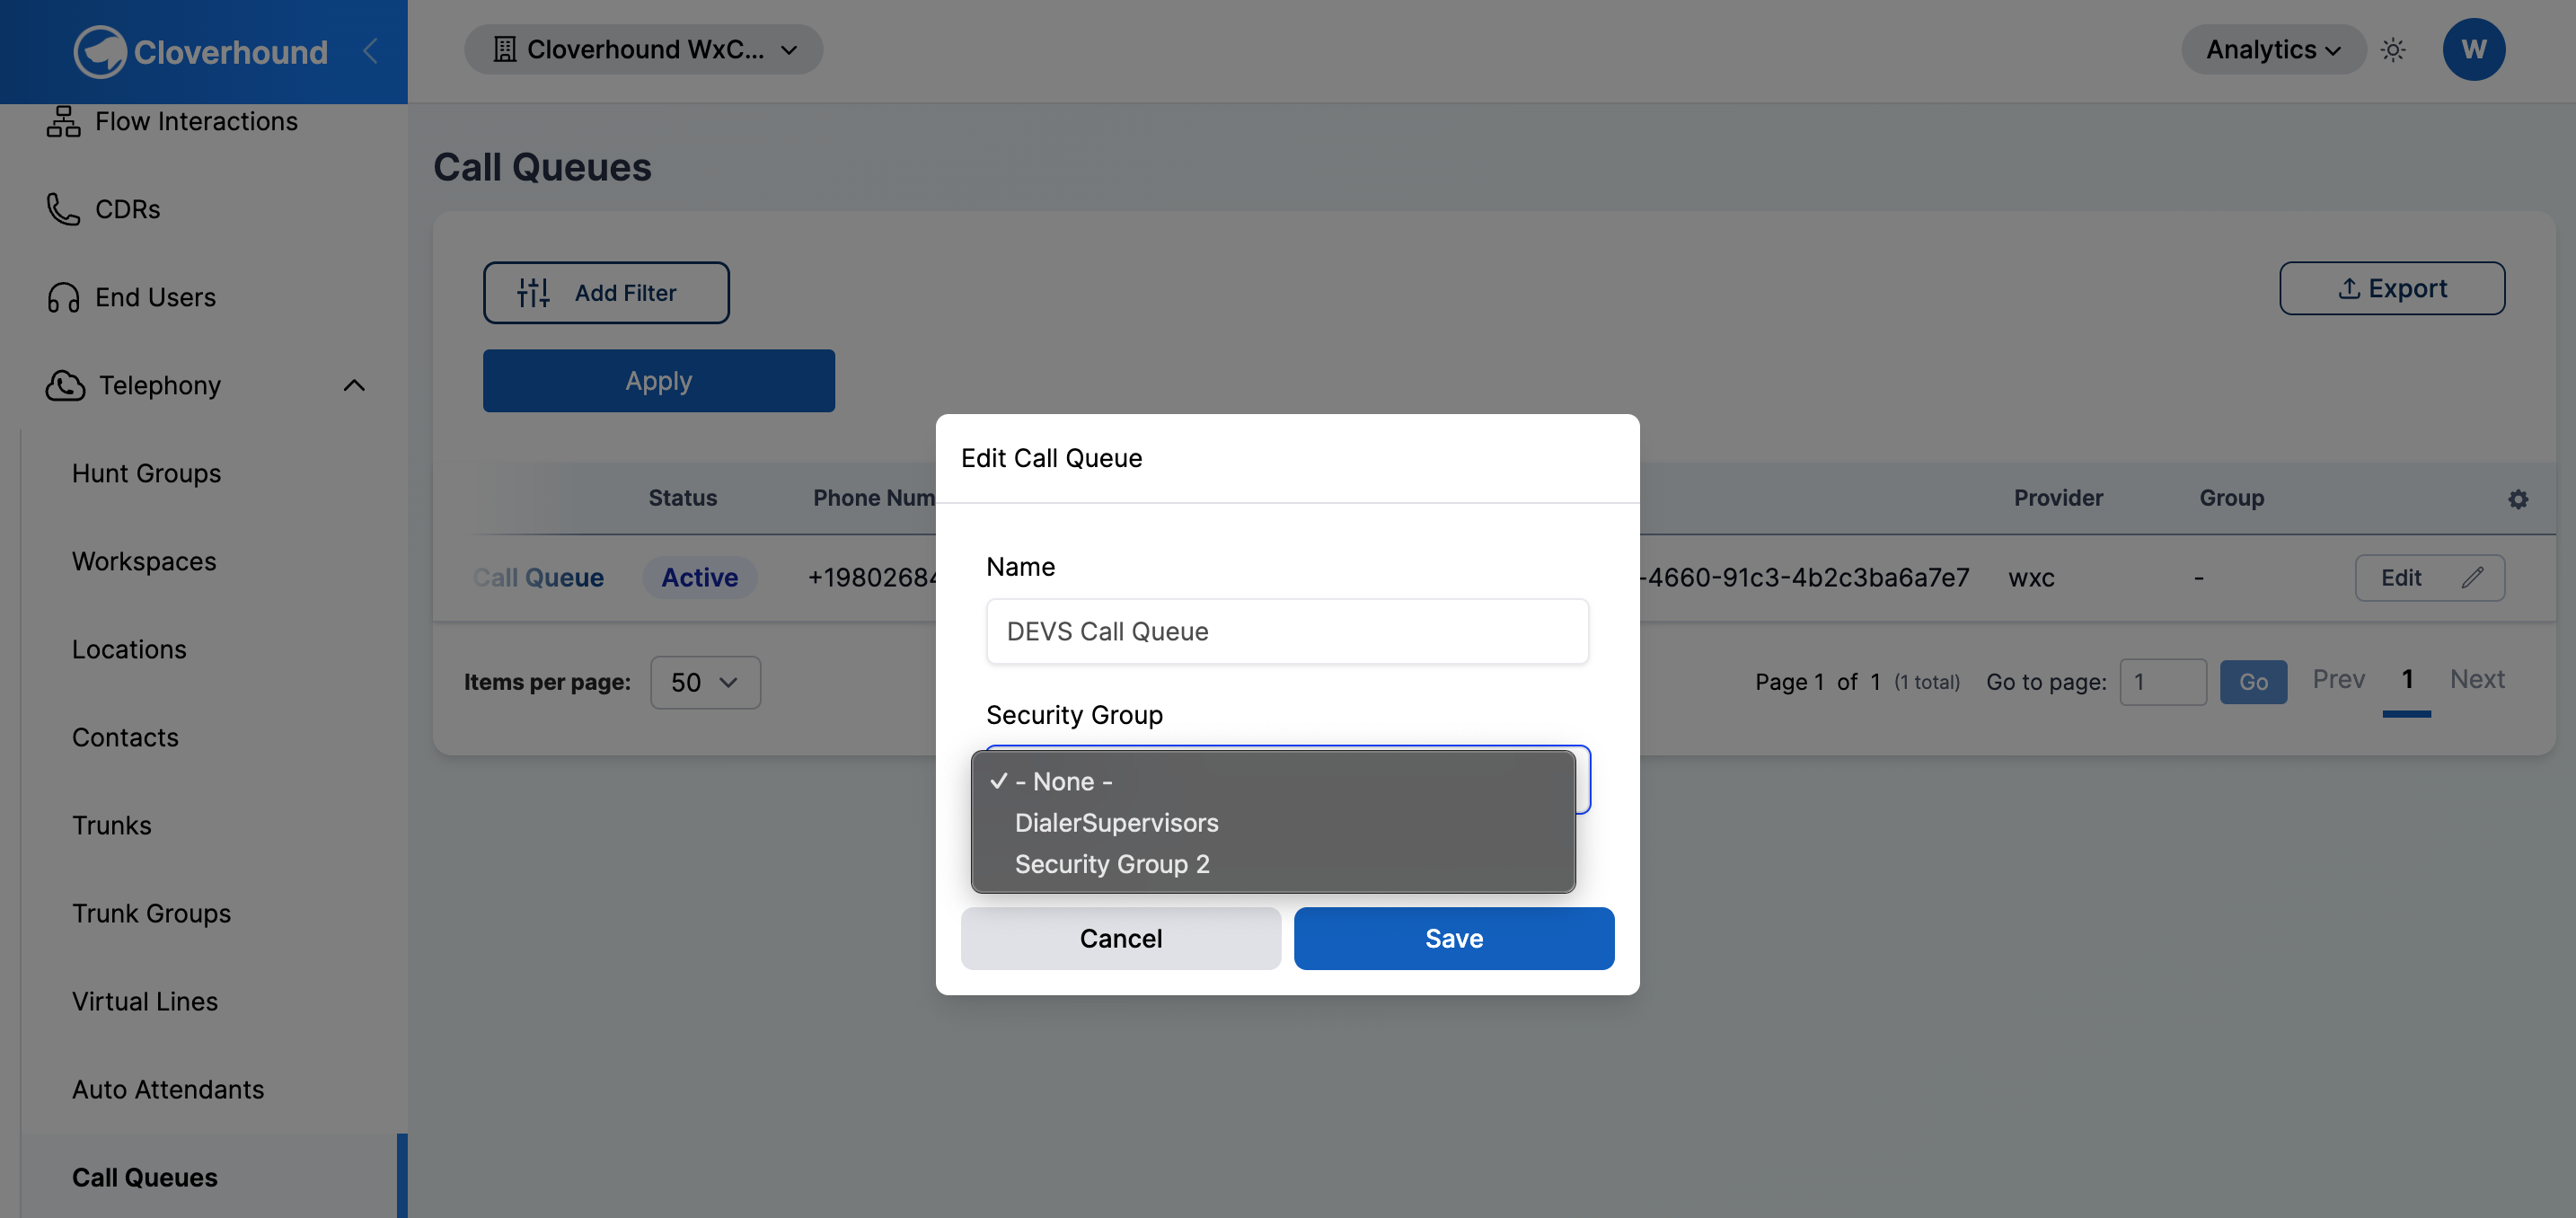
Edit a call queue (administrators with the Manage Call Queues permission) by clicking the row's edit button. The form lets you change the Security Group; the Name is read-only when the queue is owned by an external provider such as Webex.
Opening a Call Queue
Click the queue's Name in the table to open its detail page.
Detail Page Layout
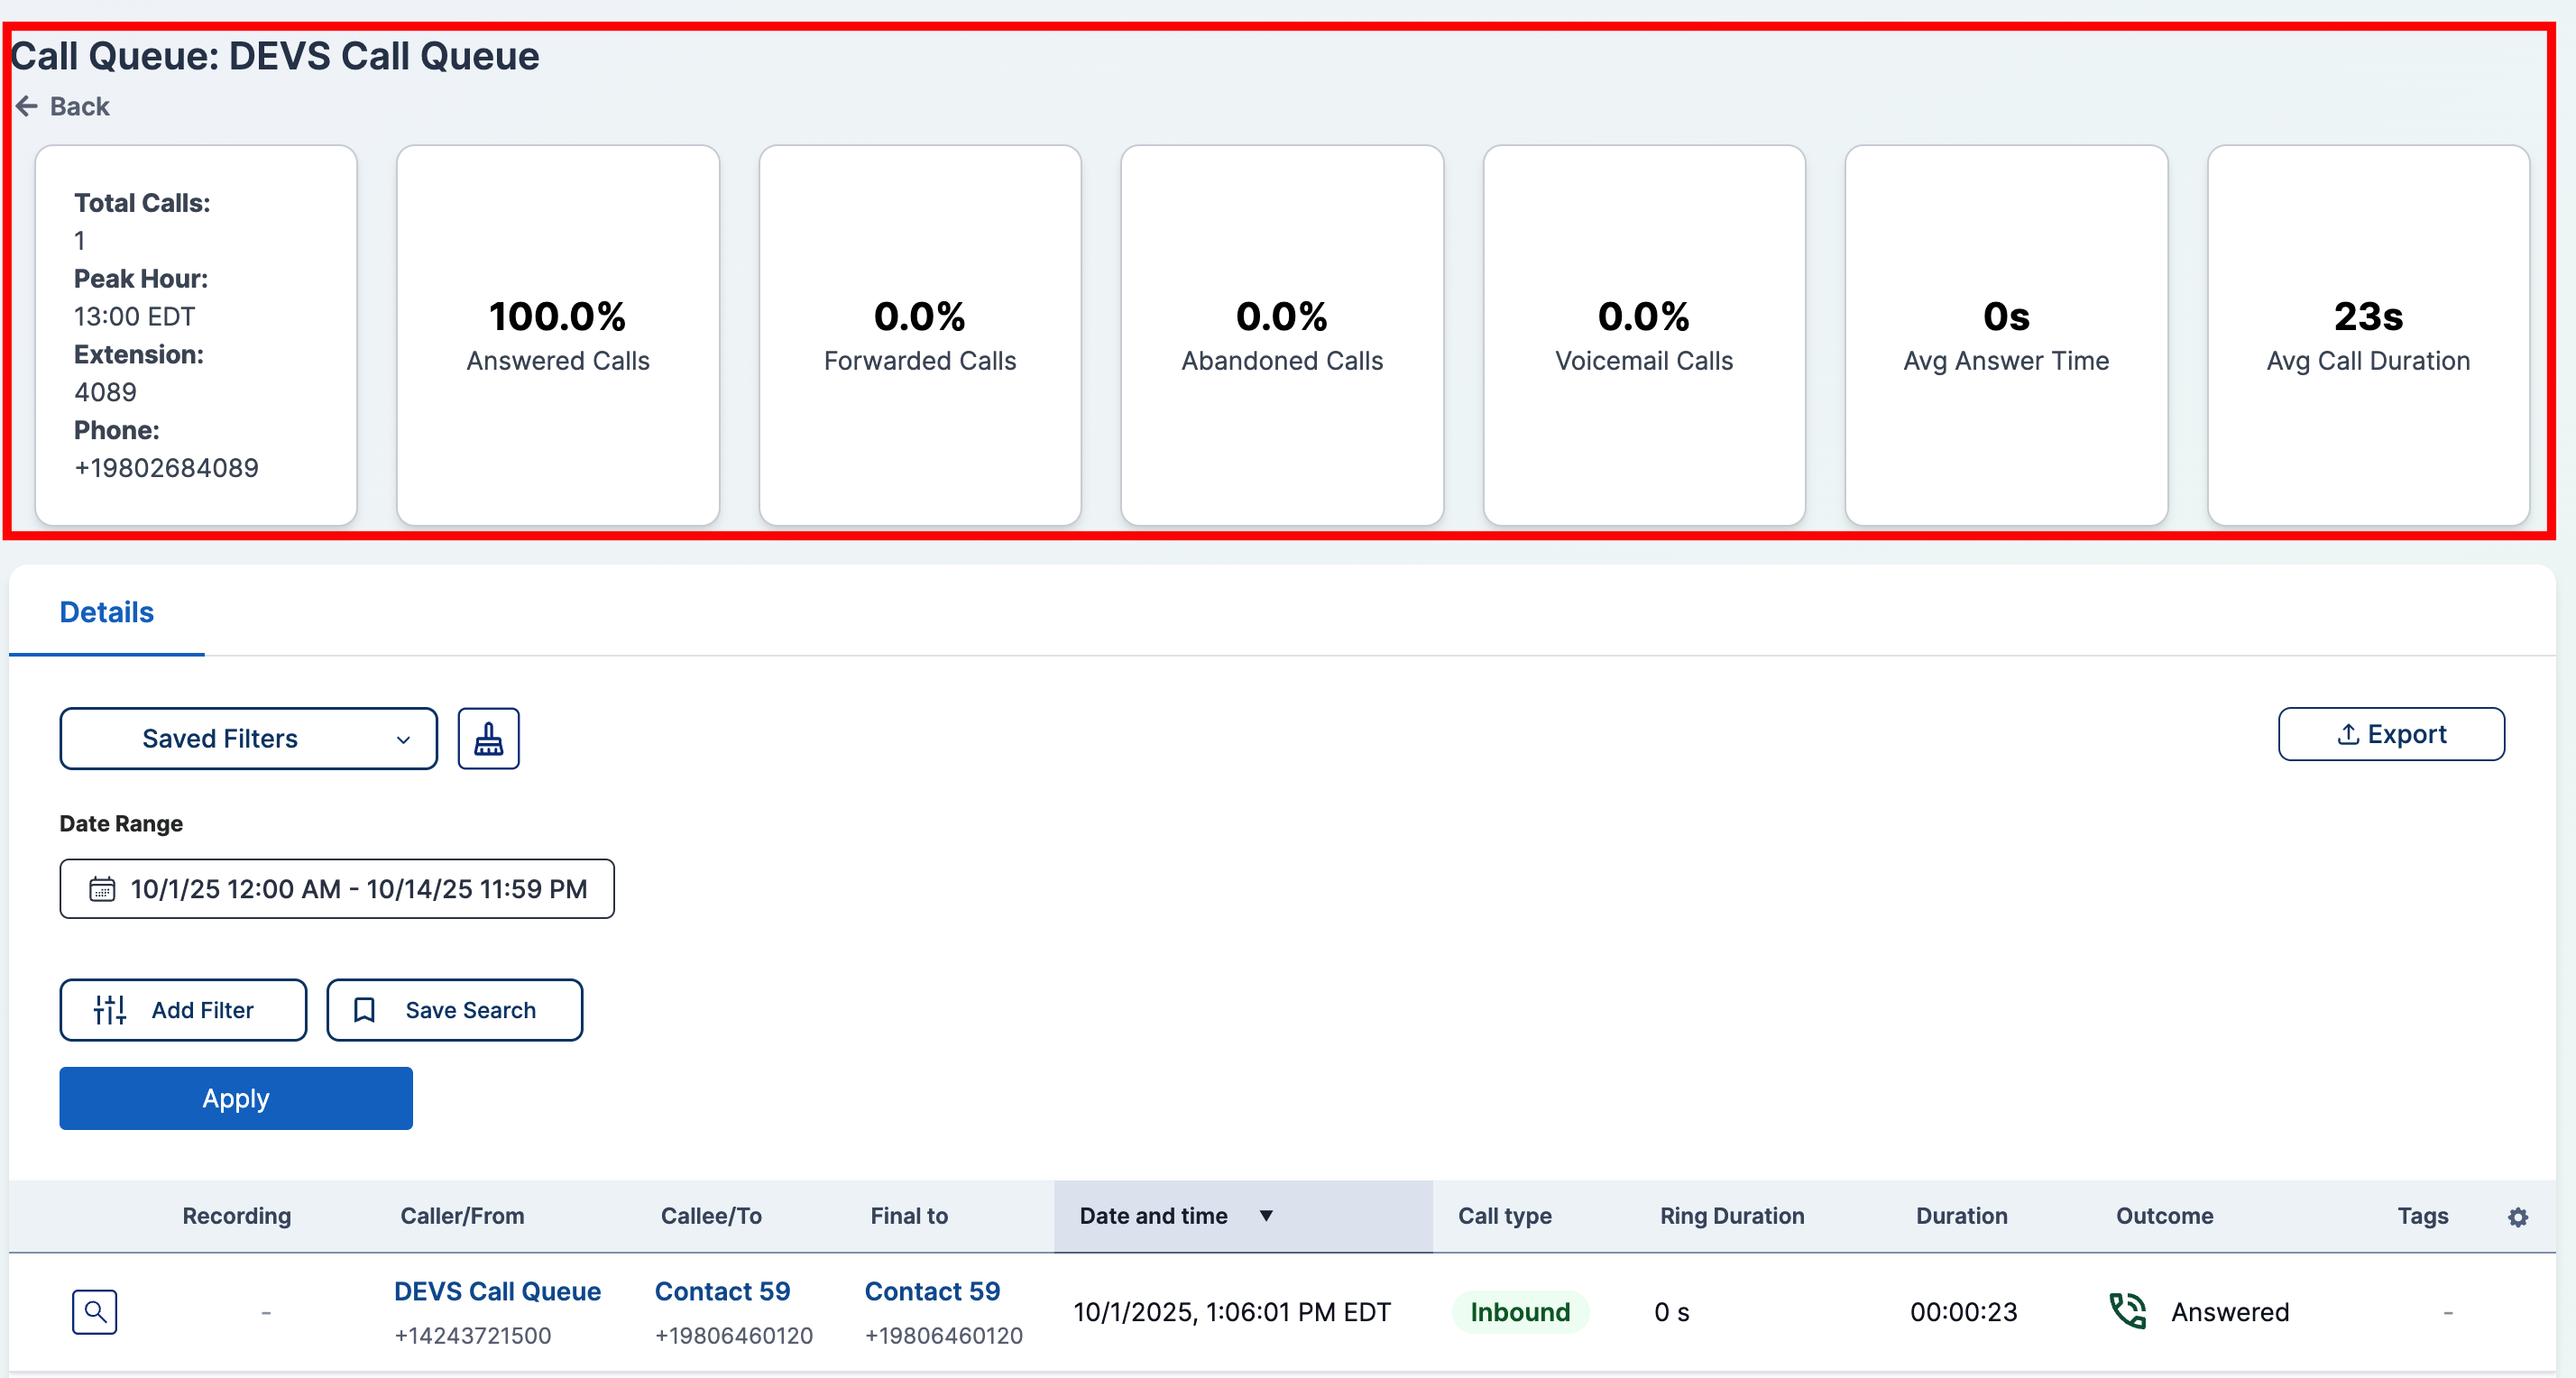
The detail page has three regions: a header, a row of metric cards, and a Calls table.
Header
The page title reads Call Queue: <name>.
Metric Cards
A row of cards summarizes the queue's activity over the selected date range:
- Total Calls and Peak Hour (in your effective time zone), plus the queue's Extension and Phone.
- Answered Calls — percentage of calls answered.
- Forwarded Calls — percentage forwarded.
- Abandoned Calls — percentage abandoned.
- Voicemail Calls — percentage routed to voicemail.
- Avg Answer Time — average seconds until an agent answered.
- Avg Call Duration — average call length in seconds.
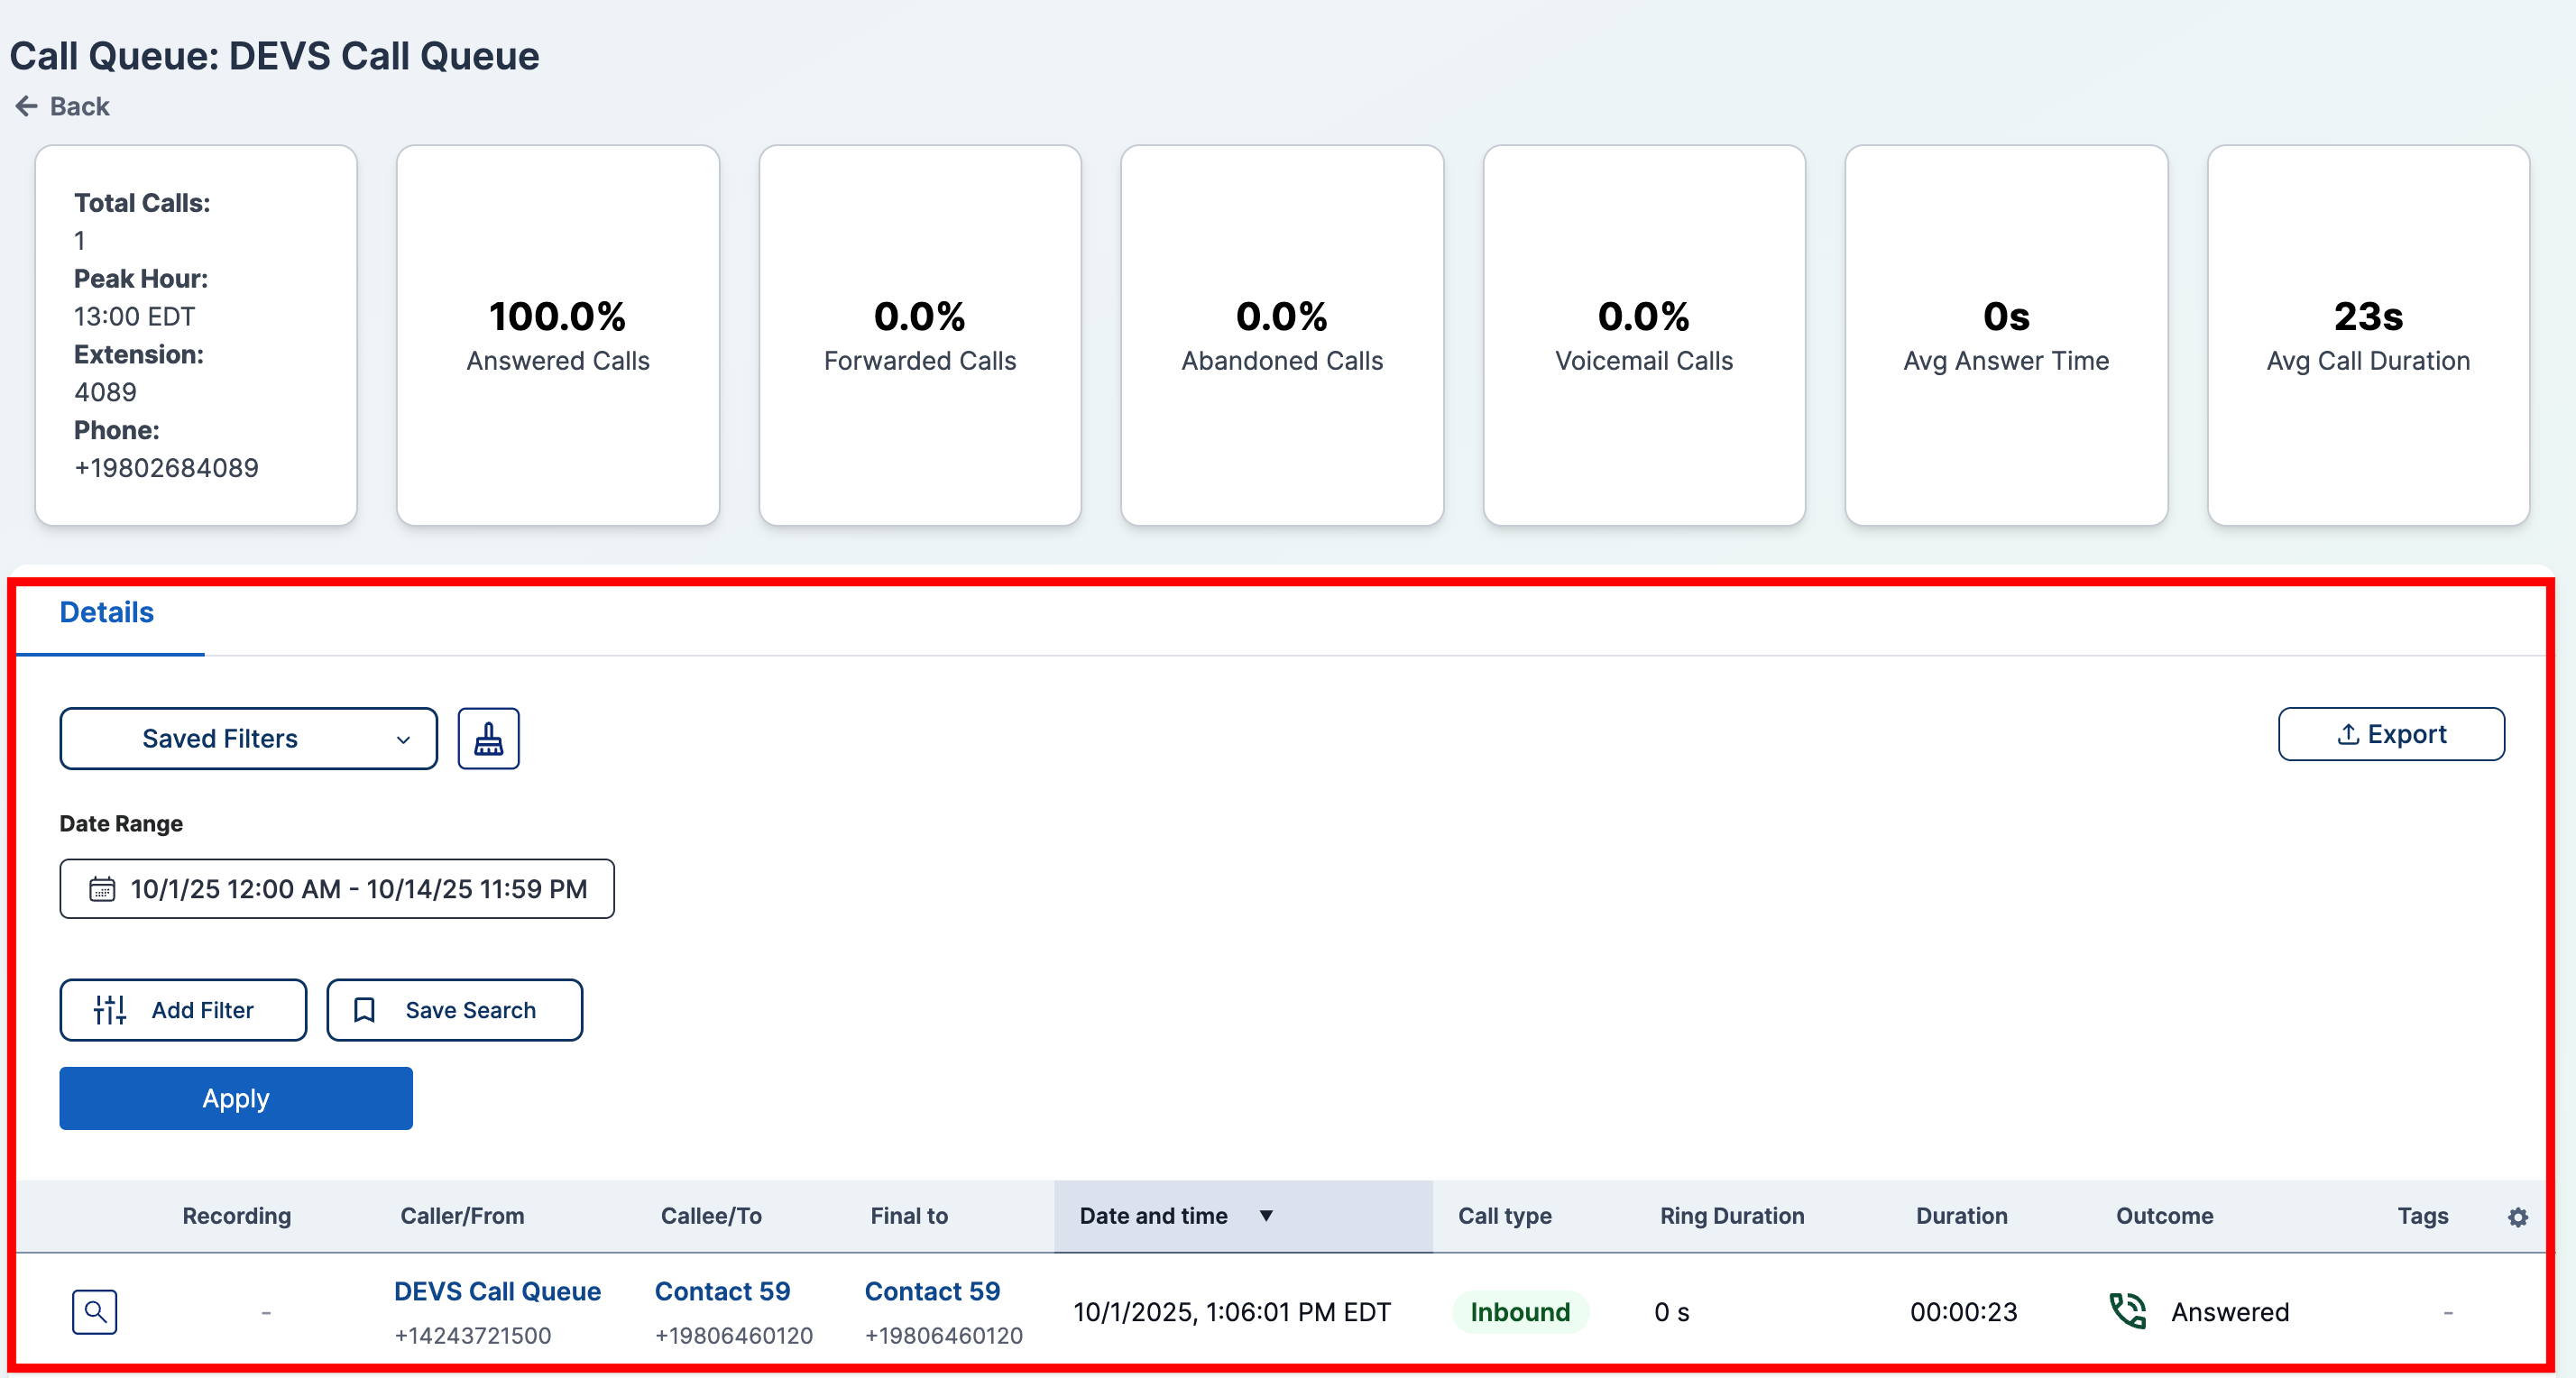
Calls Table
Below the cards, the Details tab shows every call associated with the queue, with a filter panel and the standard Calls Table columns.
Filter options on this table:
- Date Range (with time-of-day selection).
- Recordings — toggle for calls that have recordings.
- Call Type — Internal, Outbound, Inbound.
- Outcome — Answered, Not Answered, Missed, Abandoned, Forwarded, Voicemail, Transferred, Rejected, Failure, Unknown.
- Ring Duration (seconds) — numeric comparison.
- Phone Number, Name, Email — multi-field filters that match against the From side, the To side, or Both.
Click Export to download the filtered call list.
For how filter conditions, comboboxes, and direction selectors work, see Configuring a Filter. For saving filter presets, see Saving Filters.
By using the Call Queues page, you can monitor queue performance, locate calls handled by a specific queue, and manage which security group owns each queue.