Analytics Dashboard
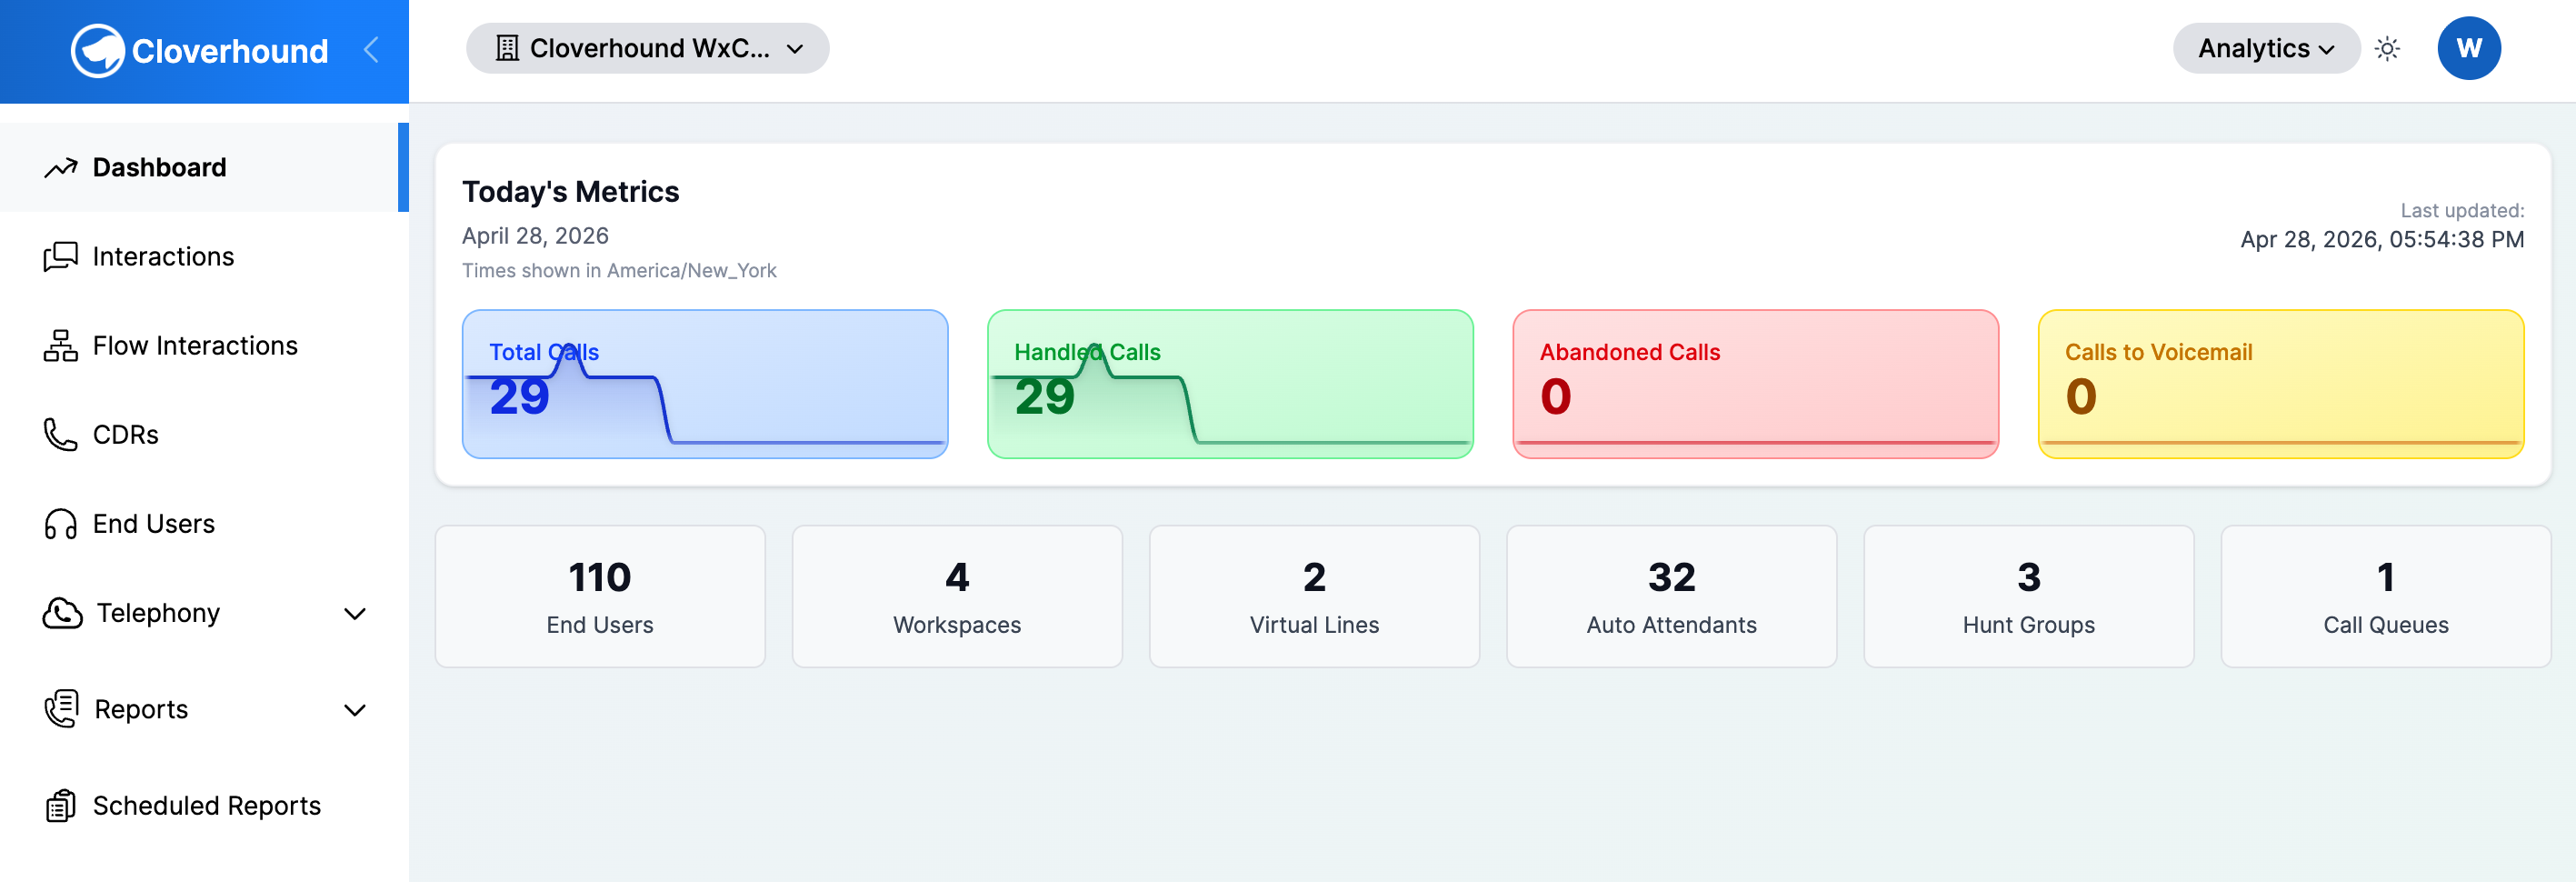
The Analytics Dashboard is the landing page of the Analytics module. It summarizes your organization's call activity for today and lists counts of the telephony resources tied to your organization, so you can check the state of your environment at a glance.
The dashboard is read-only. All figures are scoped to your organization and calculated in your organization's time zone.
The Analytics Dashboard is visible to users whose role includes read access to Analytics. If you don't see the Dashboard item in the Analytics navigation, ask your administrator to grant your role the appropriate permission.
Accessing the Analytics Dashboard
-
Navigate to the Analytics module.
-
Open the Dashboard page from the module's navigation.
The dashboard loads automatically and shows data for the current day.
Reading Today's Metrics
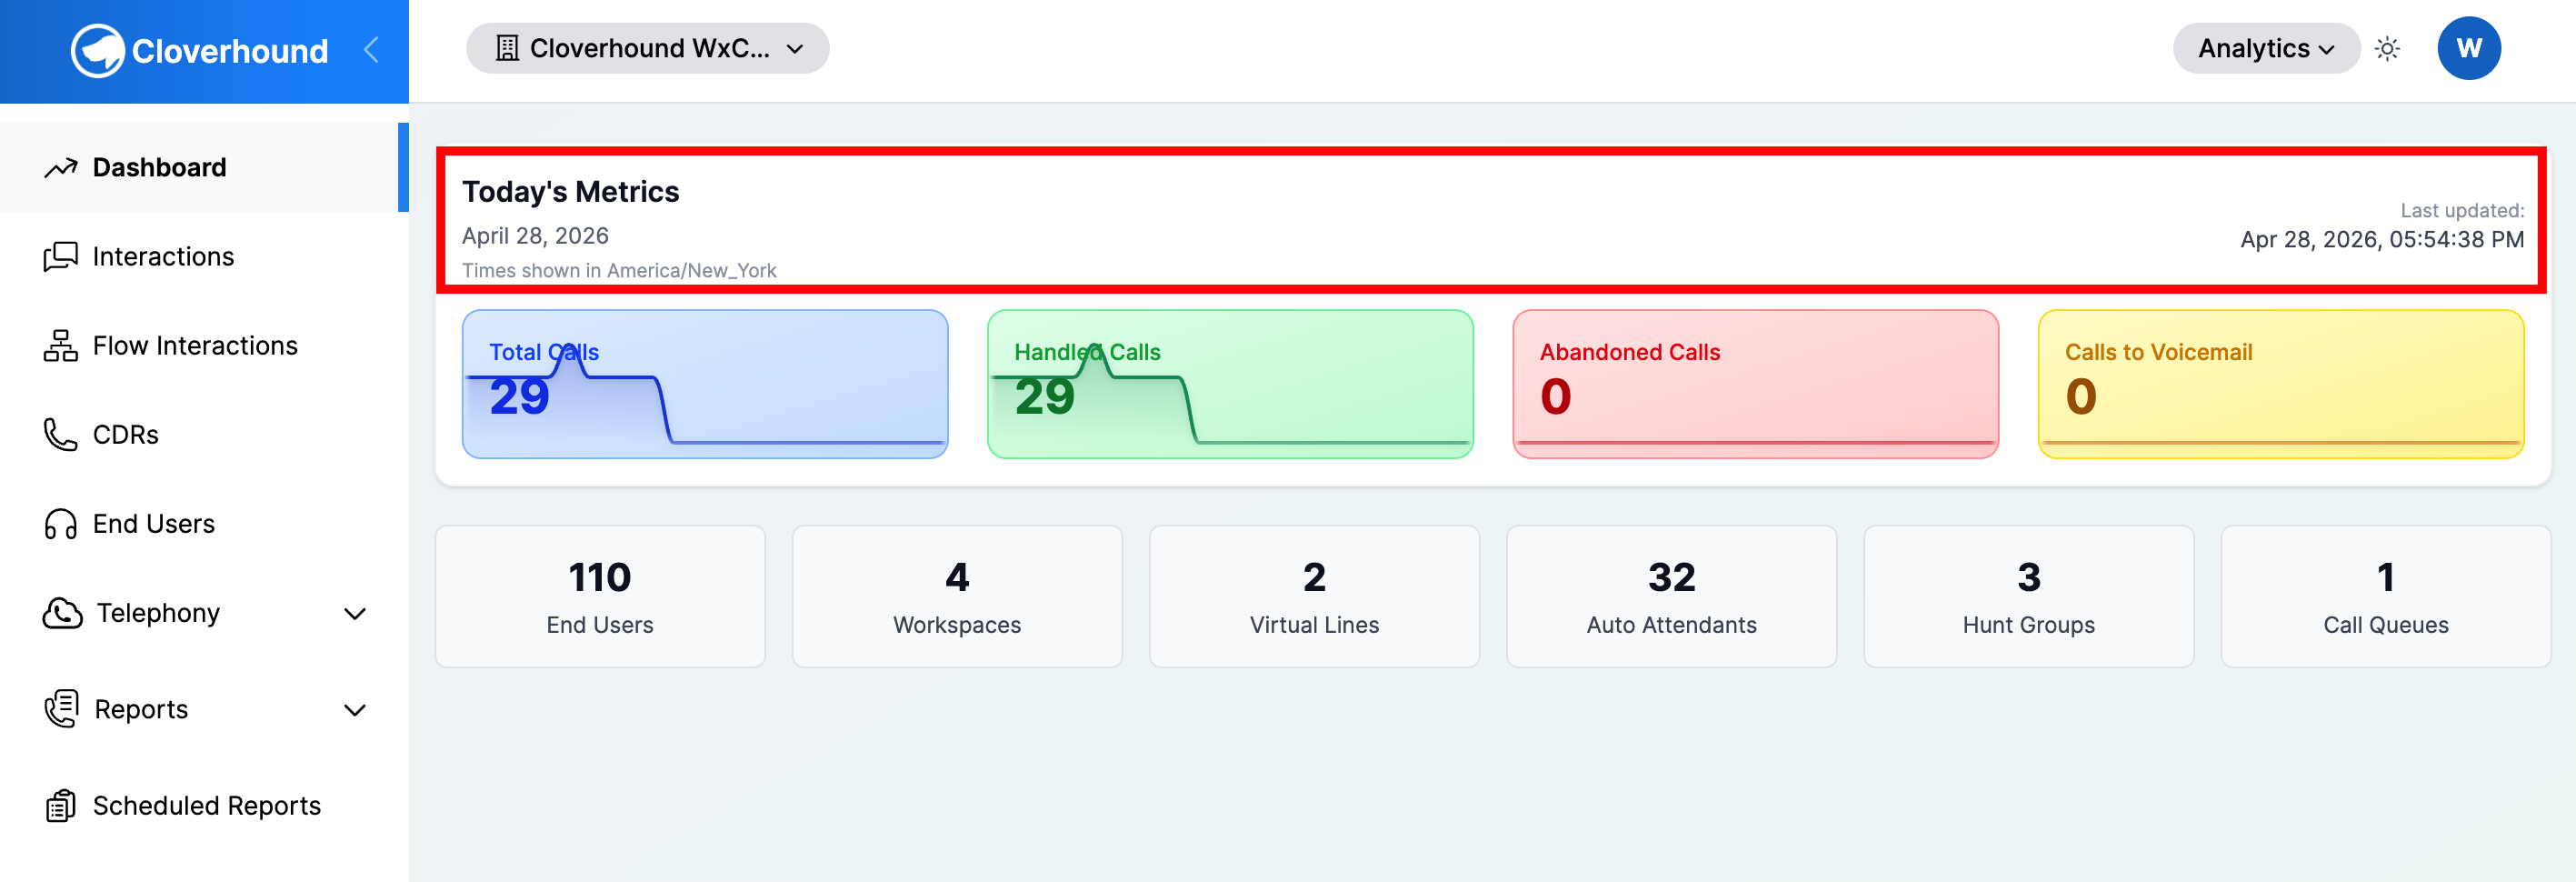
The top card on the page is labeled Today's Metrics. It shows:
-
The current date in your organization's time zone.
-
The time zone name, when it differs from UTC.
-
A Last updated timestamp on the right side of the card header.
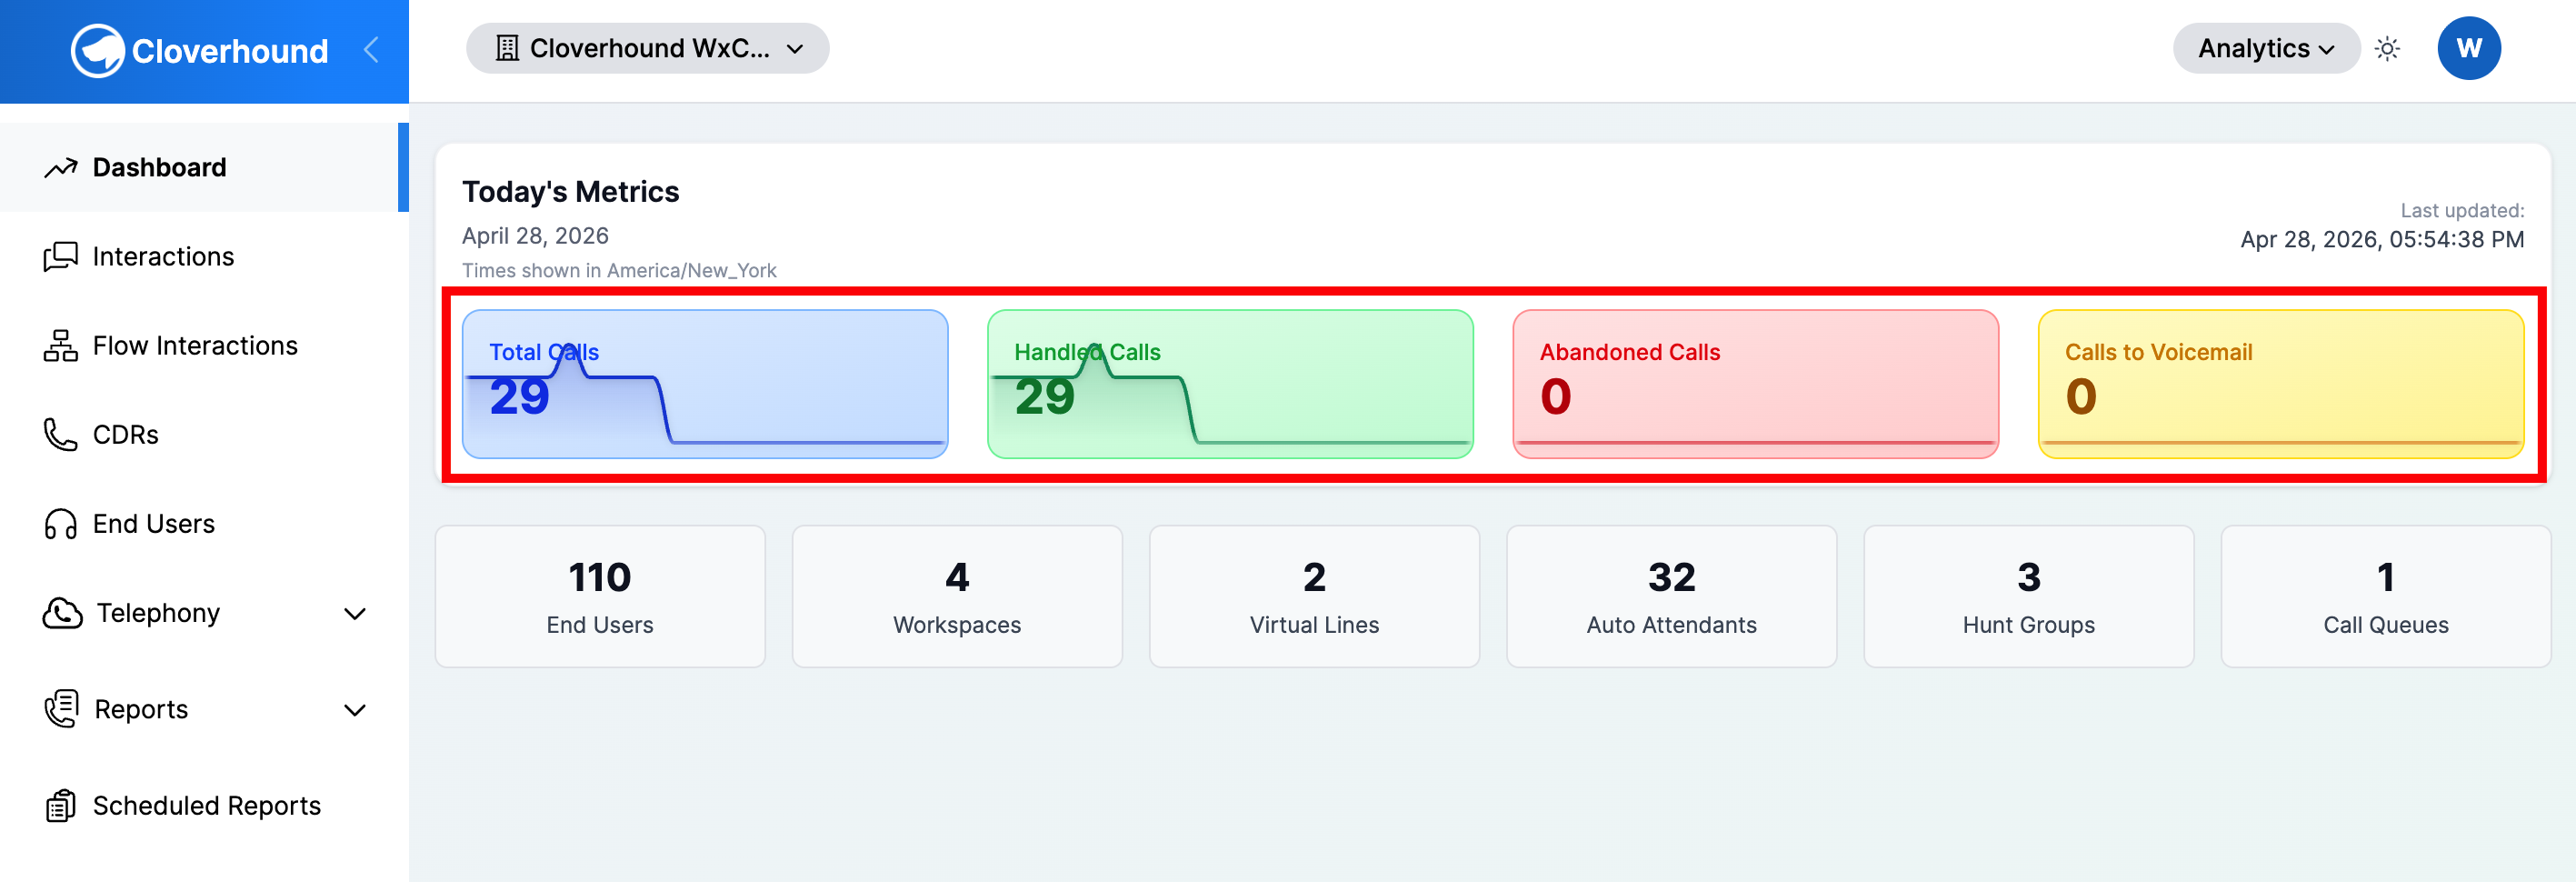
Below the header, four metric cards display today's call counts. Each card shows:
- The metric name.
- The total count for the day so far.
- A sparkline that plots the hourly breakdown of that metric across the day.
The four cards are:
-
Total Calls — every call recorded for your organization today.
-
Handled Calls — calls that were answered and did not end with a result excluded from handled (for example, calls that went to voicemail).
-
Abandoned Calls — calls whose result is classified as abandoned.
-
Calls to Voicemail — calls whose result is classified as voicemail.
If a metric has no data for today, the card shows 0 and the sparkline area displays No data available instead of a line.
Reading the Sparklines
Each sparkline covers the 24 one-hour buckets of the current day, from the start of the day through the current hour. The vertical scale of each sparkline is relative to that metric's own high and low for the day, so two sparklines are not directly comparable in height. Use the numeric total on the card to compare metrics, and use the sparkline to see when activity peaked.
"Today" starts at midnight in your organization's time zone, not in UTC. If your organization's time zone is set to something other than UTC, you will see a note under the date confirming the time zone used.
Reading Telephony Resource Counts
Below Today's Metrics, the dashboard shows a row of count cards for the telephony resources configured in your organization:
-
End Users
-
Workspaces
-
Virtual Lines
-
Auto Attendants
-
Hunt Groups
-
Call Queues
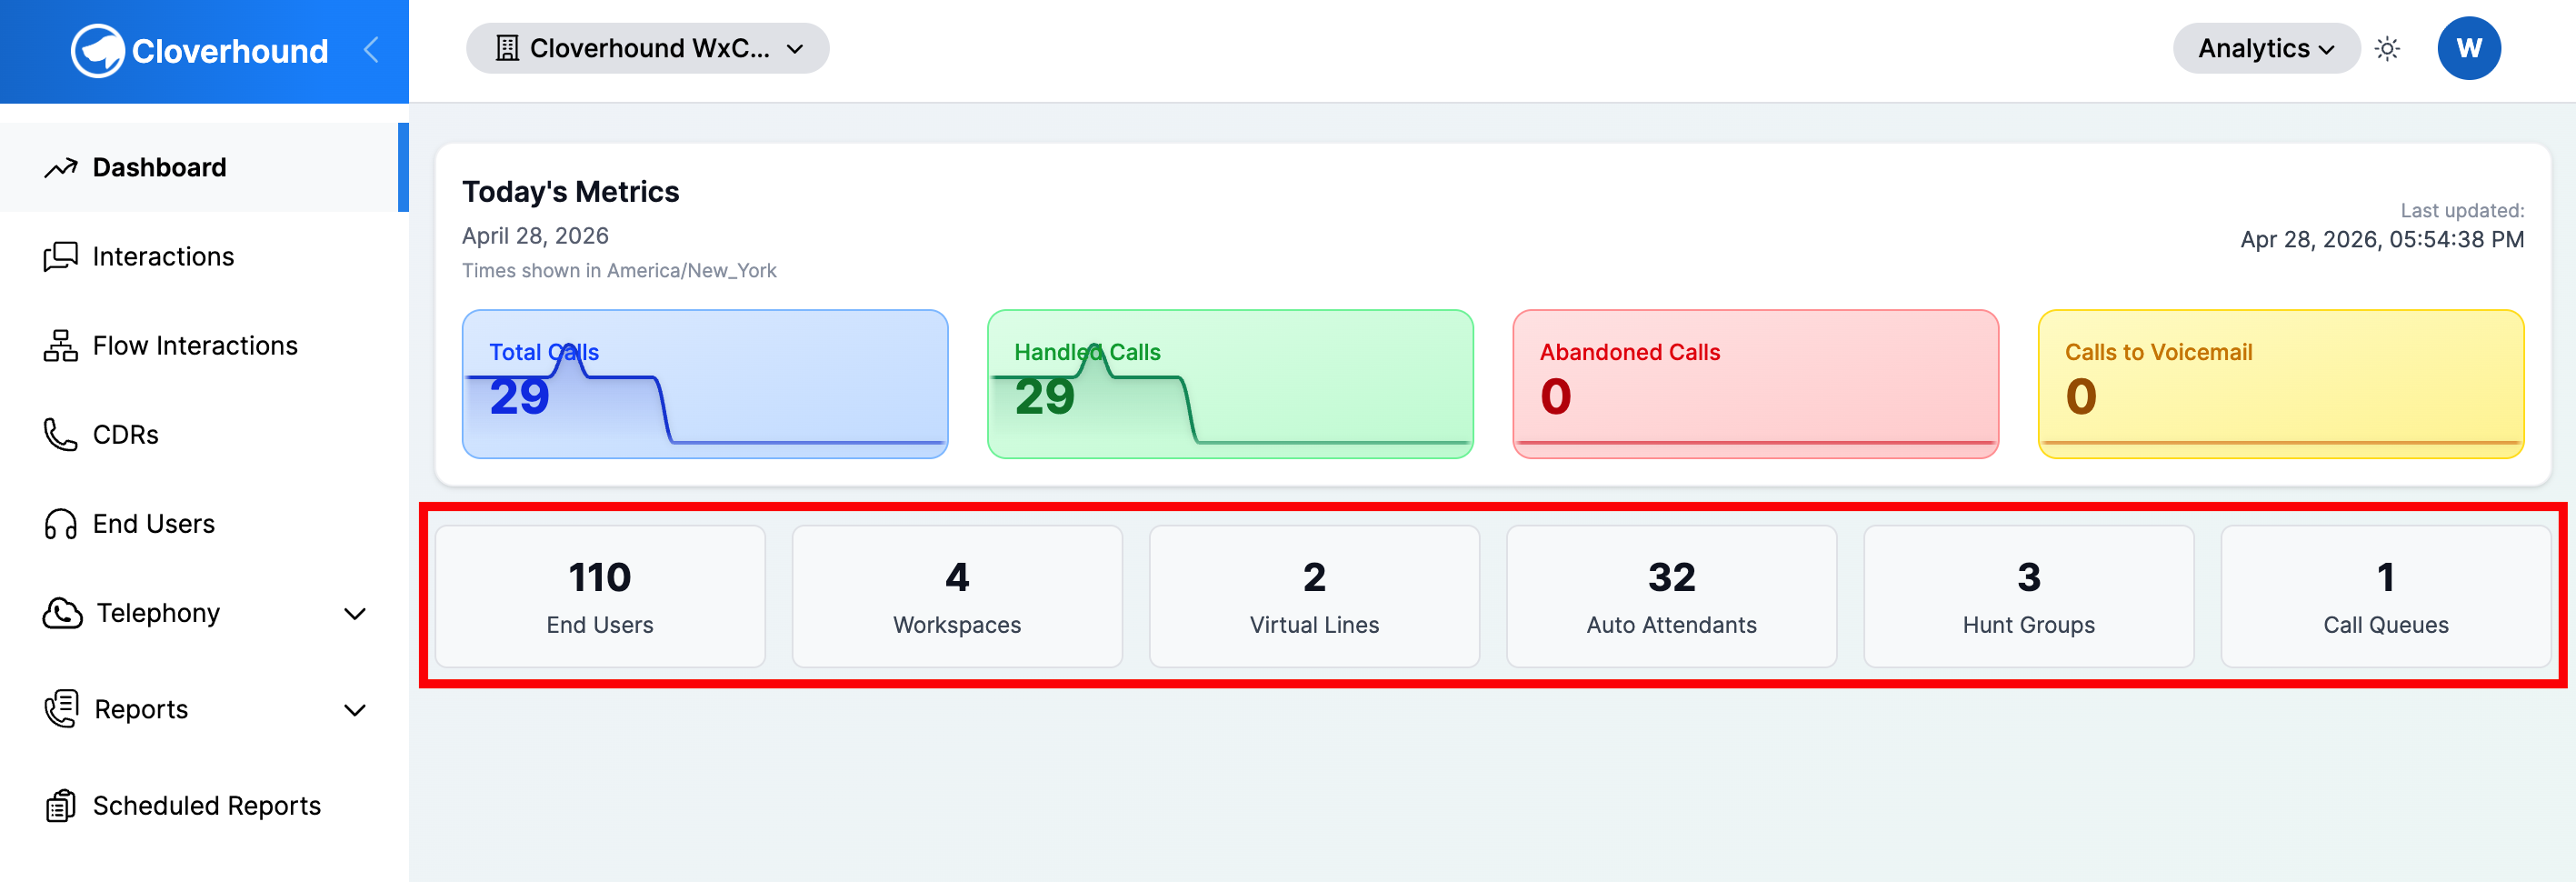
Each card shows the current total number of that resource in your organization. These counts reflect the current state of your organization, not today's activity, and they are not filtered by date.
To drill into any of these resources, use the corresponding page in the Analytics navigation:
- End Users — the End Users page.
- Workspaces — the Workspaces page.
- Virtual Lines — the Virtual Lines page.
- Auto Attendants — the Auto Attendants page.
- Hunt Groups — the Hunt Groups page.
- Call Queues — the Call Queues page.
Refreshing the Dashboard
The dashboard loads fresh metrics each time you open the page. To refresh the data without leaving the page, reload your browser.
If the dashboard cannot load its data, an error card replaces the metrics with the message Unable to Load Analytics Data.
-
Click the Try Again button to re-request the data.
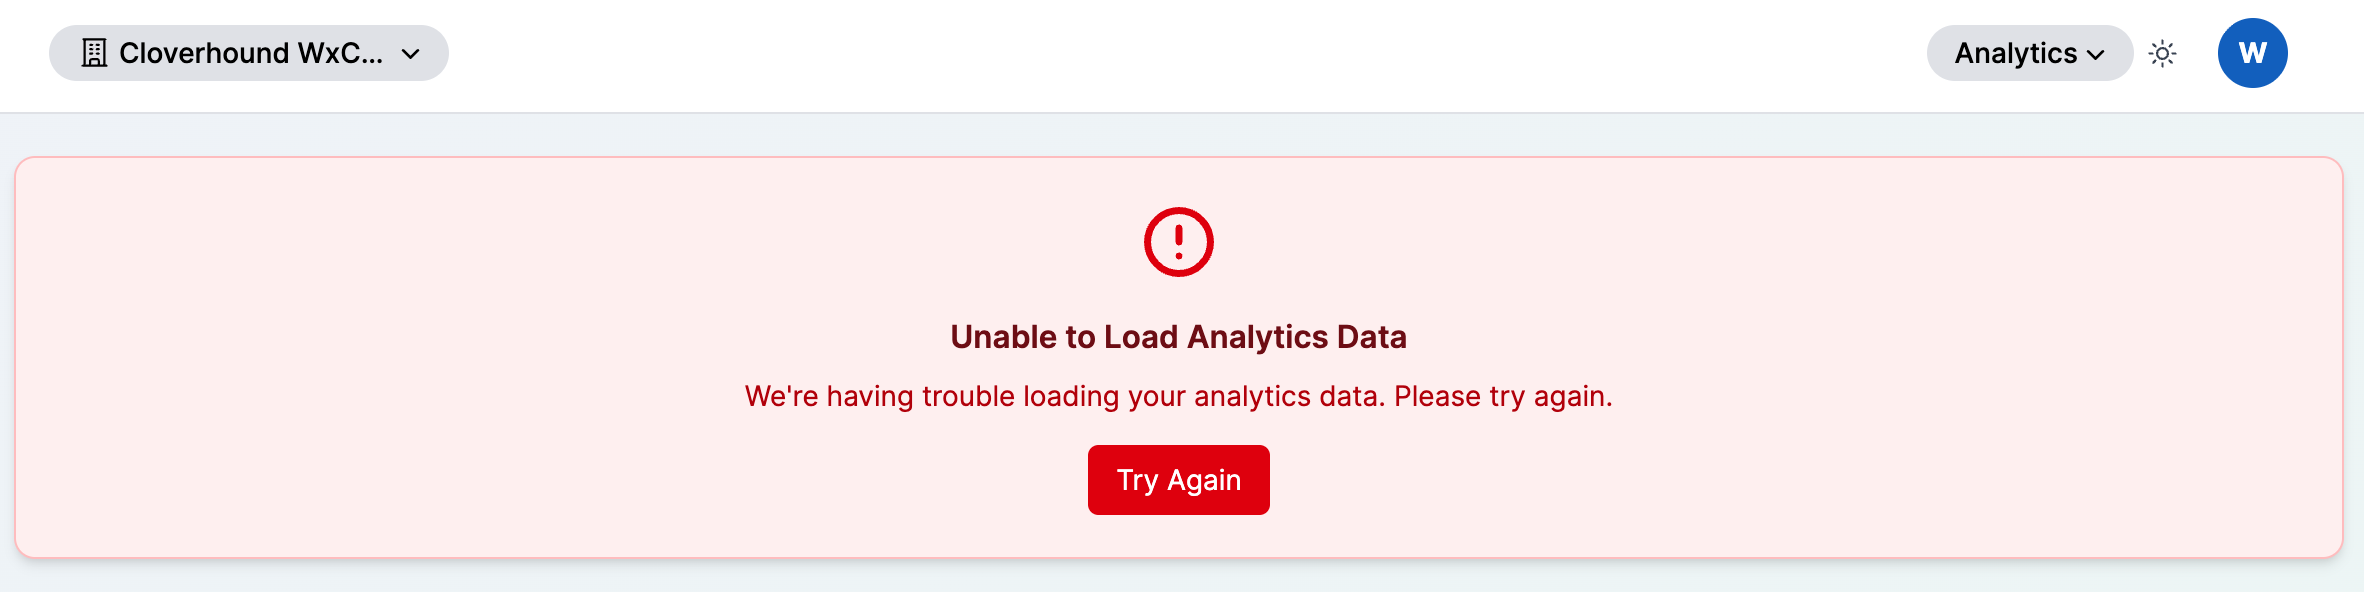
-
If the error persists, contact your administrator.
The error card appears when the metrics service cannot compute today's totals. The page will still load, but all counts will be shown as 0 until the retry succeeds.
Related Pages
- The Calls Table — drill into individual calls behind the totals on this page.
- Analytics Module — overview of the Analytics module.
From the Analytics Dashboard, you can see today's call volume, how many of those calls were handled, abandoned, or sent to voicemail, and the current size of your telephony configuration.